Chapter 3 Process Costing
Chapter 3 Process Costing. Job-Order Costing Many jobs are worked on during each period, with each job having different production requirements. Costs are accumulated by job. The job cost sheet is the key document for accumulating costs. Units costs are computed by job on a job cost sheet.

Chapter 3 Process Costing
E N D
Presentation Transcript
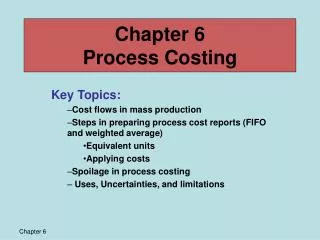
Job-Order Costing Many jobs are worked on during each period, with each job having different production requirements. Costs are accumulated by job. The job cost sheet is the key document for accumulating costs. Units costs are computed by job on a job cost sheet. Process Costing A homogeneous product is produced on a continuous basis or for long periods of time. Costs are accumulated by department. The departmental production report is the key document showing the accumulation and disposition of costs. Unit costs are computed by department on production reports. Job-Order v. Process Costing
Calculation of Equivalent Units Beginning Work-in-Process Inventory: = XXX Physical Units X 100% Started and Completed in Current Period: Physical Units X 100% = XXX Ending Work-in-Process Inventory: Percent of work completed in the current period Physical Units X XXX = Equivalent Units of Production XXX
Equivalent Units Illustration - Mixing Materials Conversion Costs Beginning WIP: Beginning WIP: 10,000 x 100% = 10,000 10,000 x 100% = 10,000 Started & Completed: Started & Completed: 50,000 x 100% = 50,000 50,000 x 100% = 50,000 Ending WIP: Ending WIP: 20,000 x 100% = 20,000 20,000 x 50% = 10,000 Equivalent Units 80,000 70,000
Equivalent Units Illustration –Mixing (alternative approach) Materials Conversion Costs Units Completed: Units Completed: 60,000 x 100% = 60,000 60,000 x 100% = 60,000 Ending WIP: Ending WIP: 20,000 x 100% = 20,000 20,000 x 50% = 10,000 Equivalent Units 80,000 70,000
Cost Per Equivalent Unit (EU) of Production Production Cost for Component (include costs carried forward from beginning WIP) Equivalent Units of Production for Component = Equivalent Unit Cost for Component Note: Equivalent units and cost per equivalent unit are often computed for direct materials and conversion costs (direct labor & manufacturing overhead). Conversion costs may also be calculated separately.
Cost Per Equivalent Unit Illustration - Mixing Materials Conversion $18,000 + $142,000 $31,200 + $248,800 = $4.00 = $2.00 80,000 EU 70,000 EU Total Equivalent Unit Cost: Materials $2.00 Conversion 4.00 Total EU Cost $6.00 See Direct Material, DL, & MOH Journal Entries on Page 84
Costs Accounted For Transferred Out: Transferred Out EU x Cost Per EU = XXX Cost in Ending Work-in-Process Inventory: Ending WIP EU x Cost Per EU = XXX XXX Note: Total cost is computed for direct materials and conversion costs (direct labor & manufacturing overhead). Conversion costs may also be calculated separately.
Costs Accounted For Illustration - Mixing Transferred Out: 360,000 60,000 EU x $6.00 Cost in Ending Work-in-Process Inventory: $40,000 Materials: 20,000 EU x $2.00 Conversion: 10,000 EU x $4.00 40,000 80,000 $440,000 Total Cost See Transferred In Journal Entry on Page 84
Equivalent Units Illustration - Packaging Materials Conversion Costs Beginning WIP: Beginning WIP: 15,000 x 100% = 15,000 15,000 x 100% = 15,000 Started & Completed: Started & Completed: 55,000 x 100% = 55,000 55,000 x 100% = 55,000 Ending WIP: Ending WIP: 5,000 x 100% = 5,000 5,000 x 40% = 2,000 Equivalent Units 75,000 72,000
Equivalent Units Illustration – Packaging (alternative approach) Materials and Transferred In Conversion Costs Units Completed (includes 60,000 transferred in from Mixing): Units Completed (includes 60,000 transferred in from Mixing): 70,000 x 100% = 70,000 70,000 x 100% = 70,000 Ending WIP: Ending WIP: 5,000 x 100% = 5,000 5,000 x 40% = 2,000 Equivalent Units 75,000 72,000
Cost Per Equivalent Unit Illustration - Packaging Materials Conversion $10,500 + $49,500 = $0.80 75,000 EU $13,500 + $83,700 = $1.35 Transferred In 72,000 EU $92,250 + $360,000 = $6.03 75,000 EU Total Equivalent Unit Cost: Materials $0.80 Transferred In 6.03 Conversion 1.35 Total EU Cost $8.18
Costs Accounted For Illustration - Packaging Transferred Out: 572,600 70,000 EU x $8.18 Cost in Ending Work-in-Process Inventory: $34,150 Materials: 5,000 EU x $6.83 Conversion: 2,000 EU x $1.35 2,700 36,850 $609,450 Total Cost
Quantity Schedule and Equivalent Units Production Report Format Units to be accounted for: Beginning work in process Started into production Units accounted for: (compute equivalent units) Transferred out (from beginning WIP & started & completed) Ending work in process Total and Unit Cost Costs to account for: Beginning work in process Started into production Cost Reconciliation Costs accounted for: Transferred out (from beginning WIP & started & completed) Ending work in process