Download
1 / 18
180 likes | 266 Views
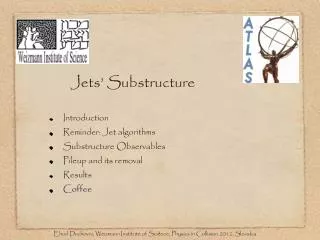
Substructure of a MAP-Streamer. Mark A. Liniger (MeteoSwiss) Huw C. Davies (IACETH) QJRMS, 129 , 633-651 (MAP special issue) 12 UTC 6 Nov 1999 (MAP IOP-15). Evolution of PV @ 320 K. 18 UTC 5 Nov. 12 UTC 6 Nov. 06 UTC 7 Nov. Aim.

E N D
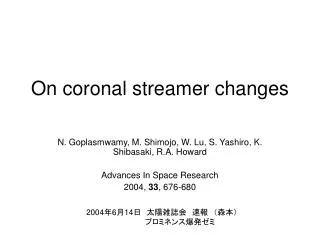
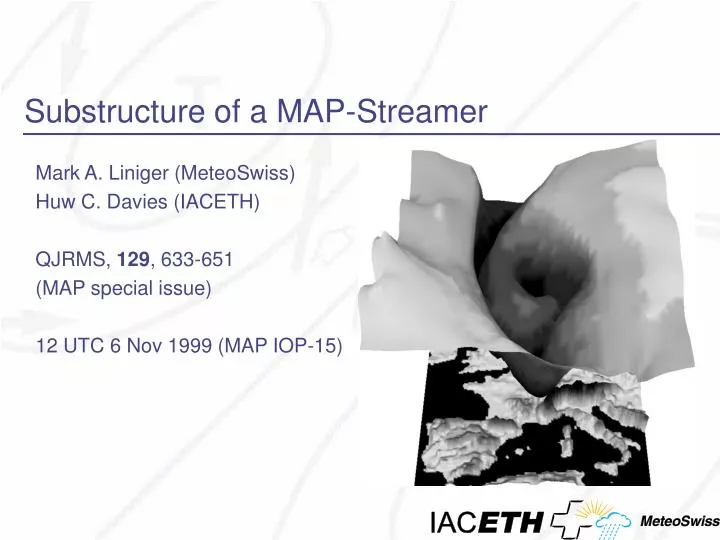
Substructure of a MAP-Streamer Mark A. Liniger (MeteoSwiss) Huw C. Davies (IACETH) QJRMS, 129, 633-651 (MAP special issue) 12 UTC 6 Nov 1999 (MAP IOP-15)
Evolution of PV @ 320 K 18 UTC 5 Nov. 12 UTC 6 Nov. 06 UTC 7 Nov.
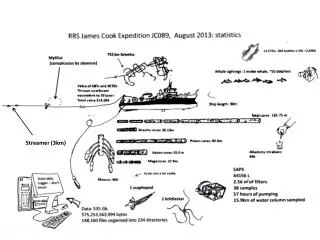
Aim • Are measured meso-scale features detectable in GCM analyzed fields? • How far are observed structures linked to synoptic scale transport processes? data sources: • ECMWF analysis fields (T319L60) • Meteosat water vapour (WV) • WV DIAL (DIfferential Absorption Lidar) flown on the Falcon aircraft of DLR (Deutsches Zentrum für Luft- und Raumfahrt)
Lagrangian Forward Projection t = 0 • bases on RDF technique (Sutton et al. 1994) • 3D – Trajectories backwardsfrom a prespecified domain • Projection of a geographical marker or conserved (or non-conserved) tracer from an earlier position to the prespecified domain. t =
horizontal WV reconstruction Meteosat WV vertically integrated WV of analysis vertically integrated WV of LFP for 24 hours white = dry
Interpretation increase in pressure increase in pot. temperature LFP for 24 hours to the 450 hPa surface
10 8 6 0.01 0.02 0.04 0.08 0.12 g/kg WV DIAL & analysis water vapour observed by DIAL (DLR) Height (km) 10 water vapour from ECMWF analysis, interpolated to observation time. Height (km) 8 6 dry humid 0 E 4 E 8 E Longitude
10 8 6 0.01 0.02 0.04 0.08 0.12 g/kg WV DIAL & LFP water vapour observed by DIAL (DLR) Height (km) 10 water vapour,LFP for 15h, based on ECMWF analyses Height (km) 8 6 dry humid 0 E 4 E 8 E Longitude
10 8 6 0.01 0.02 0.04 0.08 0.12 g/kg WV DIAL & long LFP water vapour observed by DIAL (DLR) Height (km) 10 water vapour,LFP for 39h, based on ECMWF analyses Height (km) 8 6 dry humid 0 E 4 E 8 E Longitude
0.01 0.02 0.04 0.08 0.12 g/kg backscatter ratio & long LFP 10 backscatter ratio (aerosols) observed by DIAL (DLR) Height (km) 8 6 (from Hoinka et al., 2003) 10 water vapour,LFP for 39h, based on ECMWF analyses Height (km) 8 6 dry humid 0 E 4 E 8 E Longitude
Streamers breakup, 18 hours composite composite 12 UTC 06 to 06 UTC 07 PV @ 310 K increase in pressure increase in pot. temperature contours: LFP for 24 hours to the 310 K surface
Conclusions Pronounced dry intrusion of stratospheric origin • Spiral structure: arms of distinct origins • Striation across western flank: sandwiched boundary layer air mixing by diffusion • Breakup over Alps:persistent diabatic processes north of Alpsand corresponding upper level negative PV anomaly • Large scale advection explains significant portion of mesoscale structures • LFP relates Lagrangian evolution to Eulerian fields