Download
1 / 28
340 likes | 624 Views
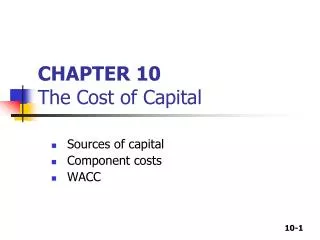
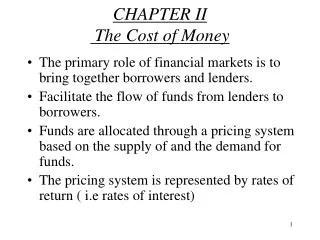
CHAPTER II The Cost of Money. The primary role of financial markets is to bring together borrowers and lenders. Facilitate the flow of funds from lenders to borrowers. Funds are allocated through a pricing system based on the supply of and the demand for funds.

E N D
CHAPTER II The Cost of Money • The primary role of financial markets is to bring together borrowers and lenders. • Facilitate the flow of funds from lenders to borrowers. • Funds are allocated through a pricing system based on the supply of and the demand for funds. • The pricing system is represented by rates of return ( i.e rates of interest)
Fundamental factors affecting the cost of money: Production opportunities Time preferences for consumption Risk: the higher the perceived risk, the higher the required rate of return. Expected inflation: The higher the expected rate of inflation, the higher the required return. The Cost of Money………..cont
What do we call the price, or cost, of debt capital? The Interest Rate ! What do we call the price, or cost, of equity capital? Return on Equity = Dividends + Capital Gains ! The Cost of Money………cont
The cost of money………..cont The interest rate paid to the savers depends on: • The rate of return producers expect to earn on invested capital. • Saver’s/investors time preferences for current versus future consumption • The riskiness of the loan • The expected future rate of inflation
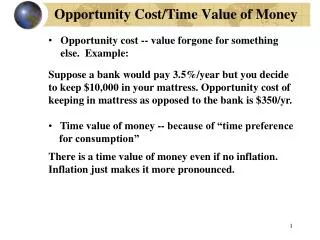
Interest Rate Levels Market A: Low-Risk Securities Market B:High-Risk Securities Interest Rate, kA Interest Rate, kB % S1 % S1 kB = 12 kA = 10 8 D1 D1 D2 0 0 Dollars Dollars
How supply and demand interact to determine interest rates in the market - If the demand curve in market A shifts to the left the equilibrium price falls to 8% and the risk premium will increase to 4% (12% -8%). - The higher premium will induce some investors in market A to shift to market B. This will cause the supply curve in A to shift to the left (up) and the supply curve in B to shift to the right (down). - The transfer of capital between markets would raise the interest rate level in A and lower it in B, bringing the risk premium back-closer to the original level of 2%.For example, when the rates on treasury securities increase ,the rates on corporate bonds and mortgages generally follow.
Short-term and Long-term interest rates • There is a price for each type of loan. The price changes overtime as shifts occur in supply and demand conditions. • Short –term interest rates are prone to rise during booms and fall during recessions. • Short term rates are responsive to current economic conditions whereas long term rates primarily reflect long run expectations for inflation. As a result, short term rates are sometimes above and sometimes below long term rates. • The relationship between long-term and short-term rates is called Term Structure of Interest Rates.
The Determinants of Market Interest Rates K (Quoted or nominal rate) = kRF + DRP + LP + MR kRF = k* + IP (kRFis proxied by the T-bill or T-bond rate) k* (k-star) = Real risk-free rate ( rate on T-bond if no inflation.) IP = Inflation premium DRP = Default risk premium LP = Liquidity premium MRP = Maturity risk premium
Premiums Added to k* for different Types of Debt: IP = Inflation premium. The rate of inflation built into interest rates is the rate of inflation expected in the future. It is the average inflation expected over the life of the asset. DRP = Default risk premium. • Treasury securities have no default risk, so they carry the lowest interest rate. • For corporate bonds, the better the bonds overall rating ,the lower its default risk and the lower its interest rate. • DRP is therefore the difference between the interest rate on a government T-bond and a corporate bond of equal maturity and marketability.
Premiums Added to k* for different Types of Debt: LP = Liquidity premium: a premium added to the rate on a security if the security cannot be converted to cash on short notice and at close to the original cost. MRP = Maturity risk premium is a premium that reflects interest rate risk. • The prices of bonds change when interest rates change (prices decline when interest rates rise and vice versa). • The longer the time to maturity of a bond ,the greater its interest rate risk. • MRP is extremely difficult to measure accurately, but it seems to vary overtime, rising when interest rates are more volatile and uncertain then falling when interest rates are more stable. • While L_T bonds are heavily exposed to maturity risk, S-T investments are heavily exposed to reinvestment risk
Premiums Added to k* for different Types of Debt: • Short-Term (S-T) Treasury: Add only IP for short term inflation. • Long-Term (L-T) Treasury: add IP for L-T inflation , MRP • Short-Term Corporate : Short –term IP , DRP,LP • Long-Term corporate : IP,DRP,MRP,LP
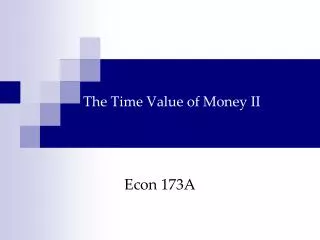
Interest Rate (%) 16 14 12 10 8 6 4 2 0 1 5 10 20 U.S. Treasury Bond Interest Rates on Different Dates Yield Curve for March 1980(Current rate of inflation: 12% Term to Interest RateMaturity Mar 1980 Mar 19996 months 15.0% 4.6%1 year 14.0 4.95 years 13.5 5.210 years 12.8 5.520 years 12.5 5.9 Yield Curve for March 1999(Current rate of inflation: 2% Short Term Intermediate Term Long Term
The term structure of interest rates • This refers to the relationship between yields and maturities of securities( i.e. the relationship between long and short term rates) • Yield curve depicts the relationship between yields and maturities of securities. • An upward sloping yield curve is described as “normal" yield curve. • A downward sloping curve is described as “inverted” or" abnormal”
Term Structure Theories Why do yield curves differ ? Three Explanations for the shape of the Yield Curve • Expectations Theory • Liquidity Preference Theory • Market Segmentation Theory
Expectations Theory • Shape of curve depends on investors’ expectations about future inflation rates. • If inflation is expected to increase ;the curve will be upward sloping (normal yield curve) • If the rate of inflation is expected to decline, the curve will be downward sloping ( abnormal or inverted yield curve). • Under the expectation theory, the MRP is assumed to be zero.
Calculating Interest Rates under Expectations Theory: • Example 1: You are given the following information and you are asked to calculate the quoted interest rate on a treasury bill with maturities of 1,5,10,and 20 years? • Inflation for Yr 1 is 5%.Inflation for Yr 2 is 6%.Inflation for Yr 3 and beyond is 8%.k* = 3%MRPt = 0.1% (t-1)
Calculating Interest Rates……………cont Step 1: calculate the IPs i.e Find the average expected inflation rate over years 1 to N: IP1 = 5%/ 1.0 = 5.00% IP10 = [ 5 + 6 + 8(8)] / 10 = 7.5% IP20 = [ 5 + 6 + 8(18)] / 20 = 7.75% Investors Must earn these IPs to break even vs. inflation;these IPs would permit you to earn k* (before taxes).
Calculating Interest Rates under Expectations Theory: • Step 2: Find MRP based on this equation: MRPt = 0.1% (t - 1) MRP1 = 0.1% x 0 = 0.0% MRP10 = 0.1% x 9 = 0.9% MRP20 = 0.1% x 19 = 1.9%
Calculating Interest Rates……………cont Step 3:Add the IPs and MRPs to k*: kRFt = k* + IPt + MRPt kRF = Quoted market interest rate \ on treasury securities. Assume k* = 3%. 1-Yr: kRF1 = 3% + 5.0% + 0.0% = 8.0% 10-Yr: kRF10 = 3% + 7.5% + 0.9% = 11.4% 20-Yr: kRF20 = 3% + 7.75% + 1.9% = 12.7%
Yield Curve Yield Curve Interest Rate (%) Treasury yield curve 12.7% 11.4% 8.0% Years to maturity
Liquidity Preference Theory • Lenders prefer S-T securities because they are less risky and provide greater investment flexibility ( more liquid) than longer-T securities. Investors will therefore accept lower yields on S-T securities and this leads to relatively S-T interest rates. • Borrowers prefer L-T debt ,because S-T debt exposes them to the risk of having to repay the debt under adverse conditions. • Thus both lender and borrower preferences operate to cause S-T rates to be lower than L-T rates. • The above two sets of preferences imply that a positive MRP exists and it increases with years to maturity causing the yield curve to be upward sloping .
Market Segmentation Theory • Each borrower and lender has a preferred maturity. • The slope of the yield curve depends on supply and demand for funds in the L-T and S-T markets (curve could be flat, upward, or downward sloping). • An upward sloping yield curve would occur when there is a large supply of S-T funds relative to demand ,but a shortage of L-T funds. • A downward sloping yield curve occurs when there is a relatively strong demand for funds in the S-T market compared to that in the L-T market.
Does the yield curve indicate future interest rates? • According to the expectations theory ,the yield on any bond is the average of the annual interest rates during its life. The following relationship then exists: Yield = interest rate in + interest rate on a 2-year bond the 1rst year in the 2nd year 2 • The above information can also be used to determine the expected inflation rate. To determine the expected inflation rate each year simply subtract k* from the interest rate expected to occur during the year. ( see example on pp. 68-69 ).
Other Factors that Influence Interest Rate Levels All the above three theories have some validity; that is, actual yield curves are influenced by all three sets of factors. However there are other factors that influence both the general level of interest rates and the shape of the yield curve. The most important factors are: • The Central bank Policy - The CB Controls the supply of money. -The yield curve is distorted when there is active intervention by the CB in the market. -Short-T rates will be temporarily “too low’ if the CB is easing credit and “too high “if it is tightening credit. -Long-T rates are not affected as much because they represent averages of S-T expectations.
Other Factors that Influence ………….cont. 2.Government Deficits - Larger budget deficits drive interest rates up due to a) increased demand for loanable funds ( if the govt. borrows money) or b) expectations for future inflation ( if the govt. prints money) while surpluses drive rates down due to increased supply of funds. - Whether Long or short term rates are more affected depends on how the deficit is financed . 3.Foreign Trade Balance - Foreign trade deficits push interest rates up because deficits must be financed from abroad and rates must be high enough relative to world interest rates to draw foreign investors.
Other Factors that Influence ………….cont. 4.Business Activity : - during recessions the demand for money and the rate of inflation tend to fall, and at the same time the govt. tends to increase the money supply in an effort to stimulate the economy. As a result there is a tendency for interest rates to decline during recessions. - During recessions , S-T rates decline more rapidly than L-T rates.
Interest rate levels and stock prices Interest rates have two effects on corporate profits: • Since interest is a cost to companies , interest rates have a direct effect on corporate profits. Also, interest rates affect the level of economic activity, and economic activity affects corporate profits. • Stocks and bonds compete in the marketplace for funds. Therefore a rise in interest rates will increase the rate of return on bonds, causing investors to transfer funds from the stock market to the bond market. Selling of stocks will then lower stock prices. • The reverse occurs if interest rates decline.
Interest rates and business decisions • Wrong decisions , such as using short-term debt to finance long term projects just before interest rates rise, can be very costly. • It is extremely difficult ,if not impossible, to predict future interest rate levels with consistent accuracy . • Sound financial policy calls for using a mix of long and short-term debt ,as well as equity ,in such a manner that the firm can survive in most interest –rate environment. • The optimal financial policy depends in an important way on the nature of the firm’s assets. it is more feasible to finance assets with high marketability with short- term debt.( eg. Finance current assets with short- term debt)