Download
1 / 28
280 likes | 411 Views
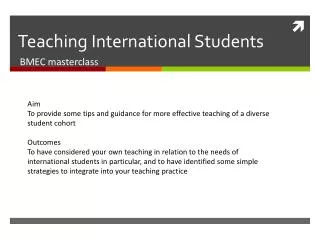
The Teaching International Students Project. Run by the Higher Education Academy Funded through the Academy, UKCISA & PMI2 2 year project. TIS Team:

E N D
Run by the Higher Education AcademyFunded through the Academy, UKCISA & PMI22 year project TIS Team: Janette Ryan, Jude Carroll, Fiona Hyland (ESCalate), Inna Pomorina (Economics), Melodee Beals (History, Classics & Archeology) , Simon Steiner (Engineering) , Malcolm Todd (C-SAP), Ali Dickens (LLAS), Andrea Frank (CEBE), Caprice Lantz (Psychology), Richard Atfield (BMAF), Adam Child & Katherine Lagar, HEA
Why TIS? • UK: 15% and rising (22.9% increase 2010 UUK) • 12% of first degree students • 66% of full-time taught postgraduates; 50% of full-time research degree students (43% of all research postgraduates)
TIS activities • Website with teaching and research Resources Bank • Researchdatabase (links with IDP, CAPRI & CICIN) • Research evidence • Outreach activities and partnerships • Series of events
Research evidence • Much qualitative data but little quantitative data • Qualitative data in different countries identifies similar areas of concern • Qualitative data inconsistent with iGraduate data
Student issues Satisfied overall but some issues persist: • Unclear expectations: don’t know the ‘rules’ • Lack of background knowledge • Language issues • Assessment issues • Difficulties participating and making friends • Know they are seen as a ‘problem’ • Do achieve well but need support
What students want • Understanding and support • Opportunities to participate • Ability to draw on own experiences • Opportunities to demonstrate knowledge and ability • Friendships with local students
International Student Barometer questions • The subject area expertise of lecturers/supervisors • The teaching ability of lecturers/supervisors/tutors • The academic content of my course/studies • The level of research activity • Getting time from academic staff when I need it/ personal support with learning • Fair and transparent assessment of my work • Studying with people from other cultures
Implications • Could be giving a false picture of the teaching and learning experiences of international students • Doesn’t help to identify specific areas for action • Importance of research evidence to engage with academics • Need an evidential rather than a polemic rationale for change • Data can help to pinpoint real ‘pressure points’, changes over time and areas for change
Impacts of data • Research on a decade of statistics of national evaluation of teaching data in Australia (Krause et al 2005) • 46% of IS felt that universities had not lived up to their expectations c/f 27% of local students • IS in UK 4% less likely to rate their courses overall as very good c/f UK students (29.1% c/f 33 %) • Academy’s analysis of PRES & PTES data Krause, K., Hartley, R., James, R. & McInnes, C. (2005). The first year experience in Australian universities: Findings from a decade of national reports. Centre for the Study of Higher Education, University of Melbourne.
NSS results for UK and International Students from 2005 to 2009 • There is a positive trend in students’ satisfaction with the quality of their degree course during this period both for UK and International students • Differences in satisfaction between UK and International students have decreased in this period, with IS being still less positive about their experiences for all but one question (Q7 Promptness of feedback) • By satisfaction we mean aggregated results for Mostly Agree and Definitely Agree responses • All differences between UK and International students are statistically significant • Need to compare with the results from other surveys in the UK and in other countries
Q2: Staff have made the subject interesting Q2: Staff have made the subject interesting • In 2005 67.6% of IS and 75.7% of UK students were satisfied • In 2009 75.0% of IS and 79.9% of UK students were satisfied • Differences in satisfaction between UK and IS have decreased from 8.1% in 2005 to 4.9% in 2009
Q3: Staff are enthusiastic about what they are teaching • In 2005 73.5% of IS and 79.6% of UK students were satisfied • In 2009 79.6% of IS and 83.8% of UK students were satisfied • Differences in satisfaction between UK and International students have decreased from 6.1% in 2005 to 4.2% in 2009
Q4:The course is intellectually stimulating • In 2005 75.0% of IS and 82.7% of UK students were satisfied • In 2009 78.8% of IS and 82.9% of UK students were satisfied • Differences in satisfaction between UK and International students have decreased from 7.1% in 2005 to 4.1% in 2009
Q6: Assessment arrangements and marking have been fair • In 2005 65.8% of IS and 73.1% of UK students were satisfied • In 2009 69.8% of IS and 73.6% of UK students were satisfied • Differences in satisfaction between UK and International students have decreased from 9.3% in 2005 to 3.8% in 2009
Q7: Feedback on my work has been prompt • In 2005 54.8% of IS and 52.6% of UK students were satisfied • In 2009 60.8% of IS and 55.8% of UK students were satisfied • The only question on which international students are more positive then UK students • Differences in satisfaction between UK and International students have increased from 2.2% in 2005 to 5.0% in 2009
Q10: I have received sufficient advice and support with my studies • In 2005 61.1% of IS and 67.7% of UK students were satisfied • In 2009 70.7% of IS and 72.7% of UK students were satisfied • Differences in satisfaction between UK and International students have decreased from 6.6% in 2005 to 2.0% in 2009
NSS and Economics Network survey results • Both NSS and EN students survey results identify similar areas of concern: • Unclear expectations – Some of the coursework has been a bit different from what I expected, e.g. I never expected to be writing this many essays! Learning experiences have not prepared me for the teaching and assessment style used in the UK as it differs very much from the system I am used to I found it hard to understand this one lecturer’s marking schemes. Difficult to work towards a goal when you don't know what is required of you
Language issues: The biggest problem for me is the language,some lecturers have strong accent or speak too fast Have lecturers that are from other countries sit English tests or classes before hiring them. It really helps communication and understanding. Same applies for other students, because it's hard to work in a team if they can't understand you Accent is torching international students
Further information/getting involved in TIS • Contact internationalisation@heacademy.ac.uk • Via website: www.heacademy.ac.uk/internationalstudents