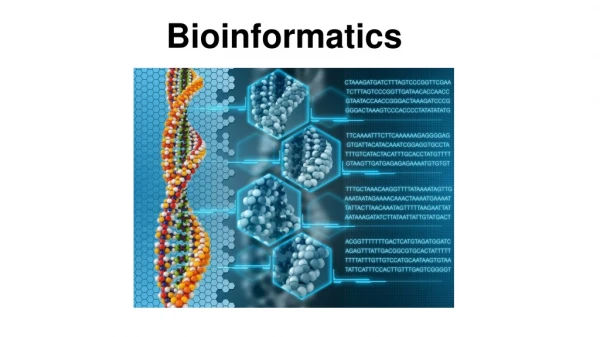
BIOINFORMATICS
SAURABH KIROLIKAR. BIOINFORMATICS. BIOINFORMATICS: DEFINATIONS. http://www.ittc.ku.edu/bioinfo_seminar/images/wheel.gif. WHY WE SELECTED THESE PAPERS? . What is Gene Expression?. It is the process by which information from a gene is used in the synthesis of a functional gene product


BIOINFORMATICS
E N D
Presentation Transcript
SAURABH KIROLIKAR BIOINFORMATICS
BIOINFORMATICS: DEFINATIONS http://www.ittc.ku.edu/bioinfo_seminar/images/wheel.gif
What is Gene Expression? • It is the process by which information from a gene is used in the synthesis of a functional gene product • These products are often proteins but in non-protein coding genes such as rRNA genes or tRNA genes, the product is a functional RNA.
Steps of Gene Expression • Transcription • RNA splicing • Translation • Post-translational modification
What is Gene Expression Profiling? • It is the measurement of the expression of thousands of genes at once, to create a global picture of cellular function. • can distinguish between cells that are actively dividing, or show how the cells react to a particular treatment.
Gene Expression Profiling • Expression profiling is a logical next step after sequencing a genome: the sequence tells us what the cell could possibly do, while the expression profile tells us what it is actually doing now.
http://www.accessexcellence.org/RC/VL/GG/images/microarray_technology.gifhttp://www.accessexcellence.org/RC/VL/GG/images/microarray_technology.gif
BIOINFORMATICS OF GENE EXPRESSION PROFILING. http://www.wormbook.org/chapters/www_germlinegenomics/germlinegenomicsfig1.jpg
Normalization • Filtering Data • Statistical analysis • Clustering • Gene Ontology • Pathway analysis
SNP • Single nucleotide polymorphism also termed as simple nucleotide polymorphism • SNPs are single nucleotide variation observed in the human genome. • Eg… AAGCCTA to AAGCTTA, Presence of 2 allele. • For a variation to be considered a SNP, it must occur in at least 1% of the population. SNPs, which make up about 90% of all human genetic variation, occur every 100 to 300 bases along the 3-billion-base human genome.
SNP (Contd….) • SNPs can occur in coding (gene) and noncoding regions of the genome. • Although more than 99% of human DNA sequences are the same, variations in DNA sequence can have a major impact on how humans respond to disease; environmental factors such as bacteria, viruses, toxins, and chemicals; and drugs and other therapies. This makes SNPs valuable for biomedical research and for developing pharmaceutical products or medical diagnostics.
SNP (Contd….) • SNPs are also evolutionarily stable. • Scientists believe SNP maps will help them identify the multiple genes associated with complex ailments such as cancer, diabetes, vascular disease, and some forms of mental illness. • SNPs do not cause disease, but they can help determine the likelihood that someone will develop a particular illness. • Eg…ApoE contains two SNPs that result in three possible alleles for this gene: E2, E3, and E4. Each allele differs by one DNA base, and the protein product of each gene differs by one amino acid.
By SundaresanRajasekaran Privacy of Individuals in a complex DNA database
outline • Problem Definition • Current status of the problem • Methods and materials to asses the problem • Present current research going on • Mathematical explanation of the present work • My views • conclusion
Problems posed • Contributors are no longer anonymous. • Can be tracked back very easily. • Identify the potential medical issues of the contributors. • Data no longer available for the researchers.
Background • All humans are 99.9% exactly the same. • The 0.1% difference is called the ‘Single Nucleotide polymorphism’ or SNP. • Allele’s at a particular locus can be classified as AA,AB or BB. • To convert it mathematically the values of allele’s can be considered as 0,0.5 and 1 corresponding to AA,AB and BB respectively.
How? • A mixture of various concentration was constructed. • Pick up any random individual – of any race (mostly from HapMap database). • Find the appropriate reference population by matching the mixture with the ancestral data.
Calculations • We calculate D (Yi,j) = |Yi,j-Popj| - |Yi,j-Mj| • Yi,j be the allele frequency estimate for the individual i and SNP j • We use the same formula’s to calculate Mj and POPj. • The first difference |Yi,j-Mj| measures how the allele frequency of the mixture Mj at SNP j differs from the allele frequency of the individual Yi,j for SNP j. • The second difference |Yi,j-Popj| measures how the reference population’s allele frequency Popj differs from the allele frequency of the individual Yi,j for each SNP j.
Test Statistics • By sampling 500 K+ SNPs, D(Yi,j) will follow a normal distribution which is determined by • Where U0 is the mean of D(Yk) over individuals Yk not in the mixture, • SD(D(Yi)) is the standard deviation of D(Yi,j) for all SNPsj and individual Yi, and s is the number of SNPs. • We assume U0 is zero since a random individual Yk should be equally distant from the mixture and the mixture’s reference population
The Normal Example:Testing Test an hypothesis about the mean: t-test If , tfollows a t-distribution with n-1 degrees of freedom p-value
Can we improve? • Yes. How can we do that? • By increasing the accuracy of the existing system. i.e. Be able to reduce all the false positives. • Or, we can improve this method by reducing the number of SNPs. i.e. Do feature reduction.
What is feature reduction? • Why feature reduction? • Feature reduction algorithms • Principal Component Analysis (PCA)
What is feature reduction? • Feature reduction refers to the mapping of the original high-dimensional data onto a lower-dimensional space. • Criterion for feature reduction can be different based on different problem settings. • Unsupervised setting: minimize the information loss • Supervised setting: maximize the class discrimination
High-dimensional data Gene expression Face images Handwritten digits
What is feature reduction? • Why feature reduction? • Feature reduction algorithms • Principal Component Analysis
Why feature reduction? • Most machine learning and data mining techniques may not be effective for high-dimensional data • Query accuracy and efficiency degrade rapidly as the dimension increases. • The intrinsic dimension may be small. • For example, the number of genes responsible for a certain type of disease may be small.
What is feature reduction? • Why feature reduction? • Feature reduction algorithms • Principal Component Analysis
Feature reduction algorithms • Unsupervised • Latent Semantic Indexing (LSI): truncated SVD • Independent Component Analysis (ICA) • Principal Component Analysis (PCA) • Canonical Correlation Analysis (CCA) • Supervised • Linear Discriminant Analysis (LDA)
Application to microarrays • Dimension reduction (simplify a dataset) • Clustering (two many samples) • Discriminant analysis (find a group of genes) • Exploratory data analysis tool • Find the most important signal in data • 2D projections (clusters?)
Outline • What is feature reduction? • Why feature reduction? • Feature reduction algorithms • Principal Component Analysis
What is Principal Component Analysis? • Principal component analysis (PCA) • Reduce the dimensionality of a data set by finding a new set of variables, smaller than the original set of variables • Retains most of the sample's information. • Useful for the compression and classification of data. • By information we mean the variation present in the sample, given by the correlations between the original variables. • The new variables, called principal components (PCs), are uncorrelated.
Principal Component Analysis (PCA) • Information loss • Dimensionality reduction implies information loss !! • PCA preserves as much information as possible: • What is the “best” lower dimensional sub-space? The “best” low-dimensional space is centered at the sample mean and has directions determined by the “best” eigenvectors of the covariance matrix of the data x. • By “best” eigenvectors we mean those corresponding to the largesteigenvalues ( i.e., “principal components”).
Principal Component Analysis (PCA) • Geometric interpretation • PCA projects the data along the directions where the data varies the most. • These directions are determined by the eigenvectors of the covariance matrix corresponding to the largest eigenvalues. • The magnitude of the eigenvaluescorresponds to the variance of the data along the eigenvector directions.
Singular Value Decomposition (SVD) • Given any mn matrix A, algorithm to find matrices U, V, and W such that A = UWVT U is mn and orthonormal W is nn and diagonal V is nn and orthonormal
Quick Summary of PCA Organize data as an m × n matrix, where m is the number of measurement types and n is the number of samples. Subtract off the mean for each measurement type. Calculate the SVD or the eigenvectors of the covariance. To Perform SVD, first calculate the new matrix Y such that Y ≡ (1 /√n) XT where Y is normalized along its dimensions. Performing SVD on Y yields the Principal components of X.
Bianca Lott Teng Li CS 144 Clustering Algorithms for Gene Expression Files
Characteristics of Clustering Algorithms • Hierarchial -algorithms that find successive clusters using previously established clusters. • Hirarchial algorithms can be agglomerative(bottom-up) or divisive(top-down) • Agglomerative algorithms begin with each element as a separate cluster and merge them into larger clusters. • Divisive algorithms begin with the whole set and divide it into smaller clusters.
Characteristics of Clustering Algorithms(Cont’d) • Partitional algorithms determine clusters all at once. • Density-based clustering algorithm is where a cluster regarded as a region in which the density of data objects exceeds a threshold. DBSCAN and OPTICS are two typical algorithms of this kind. • Two-way clustering, co-clustering or biclustering are clustering methods where not only the objects are clustered but also the features of the objects, i.e., if the data is represented in a data matrix the rows and columns are clustered simultaneously.
Characteristics of Clustering Algorithms • Many clustering algorithms require specification of the number of clusters to produce the input data set, prior to execution of the algorithms.
Types of Clustering Algorithms that Optimize Some Quantities • CLIQUE[3]- fixes the minimum density of each dense unit by user parameter and searches for clusters that maximize the number of selected attributes. • PROCLUS[1]- requires a user parameter, l, to determine the number of attributes to be selected. • ORCLUS[2]- is close to the PROCLUS algorithm, except it adds a merging process of clusters and asks each cluster to select principal components instead of attributes.