Troubleshooting a Bending Device with Tissue and Non-Tissue Verification
10 likes | 80 Views
This study focuses on flexure testing to determine mechanical properties of tissues using a bending device. The device tracks curvature changes under loads, examining tissue elasticity for future tissue engineering applications. Validation and calibration methods are employed for accurate results.

Troubleshooting a Bending Device with Tissue and Non-Tissue Verification
E N D
Presentation Transcript
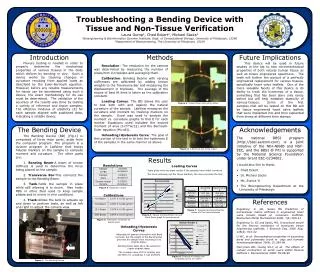
Troubleshooting a Bending Device with Tissue and Non-Tissue VerificationLaura Gump1, Chad Eckert2, Michael Sacks21Bioengineering & Bioinformatics Summer Institute, Dept. of Computational Biology, University of Pittsburgh, 152602Department of Bioengineering, The University of Pittsburgh, 15219 Figure 2: A Bend Down test using rubber Figure 3: A Bend Up test using rubber 4 1 2 3 Figure 1: The Bending Device Introduction Methods Future Implications Flexure testing is needed in order to properly determine the mechanical properties of various tissues in the body which deform by bending in vivo. Such a device works by tracking changes in curvature resulting from applied loads as described by the Euler-Bernoulli equation. However, before any reliable measurements for tissue can be ascertained using such a device, the exact methodology for its use must be determined. The validation of the accuracy of the results was done by testing a variety of reference and tissue samples. The effective modulus of elasticity (E) for each sample aligned with published data, indicating a reliable device. This device will be used in future studies in the lab to test micromechanical properties of both natural human tissue as well as tissue engineered specimens. The tests will further the pursuit of a perfectly engineered replacement for various tissues, specifically heart valve leaflets. One of the more valuable facets of this device is its ability to track the hysteresis of a tissue, something that has been done only rarely before but will help establish elasticity of various tissues.Some of the first samples that will be tested on this BD will be tissue engineered heart valve leaflets that were implanted into and then explanted from sheep at different time stamps. Resolution: The resolution for the camera was determined by measuring the number of pixels/mm in triplicate and averaging them. Calibration: Bending Beams with varying stiffnesses are calibrated by adding known weights to the Transverse Bar and measuring the displacement in triplicate. The average of the slopes of best fit lines is taken as the calibration constant. Loading Curves: The BD allows the user to test both with and against the natural curvature of the sample. LabView measures the curvature and moment by tracking markers on the sample. Excel was used to analyze the moment vs. curvature graphs to find E for each marker. Equations used included the second moment of area (I=t3*w/12) and the Bernoulli-Euler equation (M=κEI). Unloading/Hysteresis Curve: The goal of this portion of the test is to test the hysteresis E of the samples in the same manner as above. The Bending Device Acknowledgements The Bending Device (BD) [Fig.1] is comprised of three main parts, aside from the computer program. The program is a custom program in LabView that tracks fiducial markers on the sample to compute moment and curvature. The other parts are: 1. Bending Beam-A beam of known stiffness is used to determine the force being placed on the sample. 2. Transverse Bar-This connects the sample to the Bending Beam 3. Tank-holds the sample in place while still allowing it to move. Also holds PBS or other fluid used to keep sample pliable and to mimic in vivo conditions. 4. Track-Allows the tank to actuate up and down to perform tests, as well as left and right to adjust the camera view. The national BBSI program (http://bbsi.eeicom.com) is a joint initiative of the NIH-NIBIB and NSF-EEC, and the BBSI @ Pitt is supported by the National Science Foundation under Grant EEC-0234002. Results • I would also like to thank: • Chad Eckert • Dr. Michael Sacks • Ms. Eunice Yi • The Bioengineering Department at the University of Pittsburgh Resolutions Calibrations Loading Curves -Tests gives more accurate results if the samples have initial curvature -The more intensely red the tissue markers, the more accurate the test Sample in PBS .033708 mm/pixel 4.0 Beam 0.037 ± 0.003 g/mm 8.0 Beam 0.067 ± 0.002 g/mm Sample Alone .034091 mm/pixel 10.0 Beam 0.076 ± 0.005 g/mm Sample nearer Camera 0.03333 mm/pixel Stiff Beam 0.804 ± 0.017 g/mm Figure 4: Resolution values Figure 5: Calibration constants for beams used References Engelmayr Jr. GC, Sacks MS Prediction of extracellular matrix stiffness in engineered heart valve tissues based on nonwoven scaffolds.Biomechan Model Mechanobiol 2008; 7(4):309-21 EngelmayrJr, GC and Sacks, MS. A structural model for the flexural mechanics of nonwoven tissue engineering scaffolds. J Biomech Eng. 2006 Aug; 128(4): 610-22 Li WC, et all Biomechanical properties of ascending aorta and pulmonary trunk in pigs and humansXenotransplantation 2008; 15:384-89 Merryman WD, Huang SH-Y, et all The effects of cullular contraction on aortic valve leaflet flexural stiffness J. Biomechanics 2006; 39:88-96 Figure 7: Accepted and Experimental values of E for tested samples Figure 6: Typical combined Bend Up and Bend Down graph for porcine aorta Unloading/Hysteresis Curves -Attempted to gather information with Bend Up tests, but the weight of the Bending Bar prevents the sample from returning to its original shape. -Bending Down tests allow the sample to regain original shape -The average value of E for loading was 2219kPa; for unloading, it was 2051kPa Figure 8: Example of loading and unloading curves for rubber


