Download
1 / 91
930 likes | 1k Views
Gain insights into NMR spectroscopy, acquisition, processing, and interpretation of data for organic molecule structures. Historical milestones, physical basis, classical and quantum views, and spin quantization explained.

E N D
NMR spectroscopy Prepared by Dr. Upali Siriwardane For CHEM 466 Instrumental Analysis class
Objectives • Student should gain better understanding of NMR spectroscopy. • Student should gain experience in the acquisition, processing, and displaying NMR data. • Student should gain experience in interpreting NMR data in order to establish structure for unknown organic molecules. • Student should gain understanding in advanced 1Dimensional and 2Dimensional NMR techniques.
Introduction • The Nobel Prize has been awarded twice for work related to NMR. F. Bloch and E.M. Purcell received the Nobel Prize in Physics, in 1952, for the first experimental verifications of the phenomenon, and Prof. R.R. Ernst received the Nobel Prize in Chemistry, in 1991, for the development of the NMR techniques. • Since its discovery 50 years ago, in 1945, it has spread from physics to chemistry, biosciences, material research and medical diagnosis.
The Physical Basis of the NMR Experiment • Imagine a charge travelling circularily about an axis builds up a magnetic moment • It rotates (spins) about its own axis (the blue arrow) and precesses about the axis of the magnetic field B (the red arrow). The frequency of the precession () is proportional to the strength of the magnetic field: • = B0 • = magnetogyro ratio Magnetic field mrasured in Tesla 1 T = 10,000 gauss
Magnetogyric ratio() The larger the value of the magnetogyric ratio, the larger the Magnetic moment (m) of the nucleus and the easier it is to see by NMR spectroscopy. Energy difference (DE) between Iz = +1/2 and Iz = -1/2.
The Physical Basis of the NMR Experiment: • Nuclear magnetic resonance, or NMR as it is abbreviated by scientists, is a phenomenon which occurs when the nuclei of certain atoms are immersed in a static strong magnetic field and exposed to a second oscillating magnetic field in the form of radiofrequency pulses, it is possible to transfer energy into the spin system and change the state of the system. After the pulse, the system relaxes back to its state of equilibrium, sending a weak signal that can be recorded.
Larmour frequency • Precession: The circular movement of the magnetic moment in the presence of the applied field. • Larmour frequency : The angular frequency of the precessionis related to the external magnetic field strength B0, by the gyromagnetic ratiog : w0 = gB0
Classical View of NMR (compared to Quantum view) Precession or Larmor frequency: w = 2pnwo = g Bo (radians) angular momentum(l) l wo m Bo Simply, the nuclei spins about its axis creating a magnetic moment m Apply a large external field (Bo) and m will precess about Bo at its Larmor (w) frequency. Maxwell: Magnetic field Moving charge ≡ Important: This is the same frequency obtained from the energy transition between quantum states
Quantum-mechanical treatment: • The dipole moment of the nucleus is described in quantum-mechanical terms as = J • Therein, J is the spin angular momentum and the magnetogyric ratio of the spin. When looking at single spins we have to use a quantum-mechanical treatment. • Therein, the z-component of the angular momentum J is quantitized and can only take discrete values • J is related to spin quantum number of the nuclei I -I,…,o,…,+I
Spin quantum number(I) • Nuclear spin is characterized by a spin number, I, which can be zero or some positive integer multiple of 1/2 (e.g. 1/2, 1, 3/2, 2 etc.). Nuclei whose spin number, I= 0 have no magnetic moment(m);eg. 12C and 16O show no NMR signal. Elements such as 1H, 13C, 19F and 31P have I=1/2, while others have even higher spin numbers: • I=1 14N, 2H • I=3/2 11B, 35Cl, 37Cl, 79Br, 81Br. • As the values for I increase, energy levels and shapes of the magnetic fields become progressively more and more complex.
z-component of the angular momentum J For I=1/2 nuclei, m can only be +1/2 or -1/2, giving rise to two distinct energy levels. For spins with I=1 nuclei three different values for Jz are allowed:
The energy difference DE, • Zeeman effect: splitting of energy levels in magnetic field • The energy difference DE, which corresponds to the two states with m=±1/2, is then (the quantum-mechanical selection rule states, that only transitions with m= ±1 are allowed):
A Nuclei with I= 1/2 in a Magnetic Field DE = h n n = g Bo/ 2p DE = g h Bo / 2p number of states = 2I+1
A Nuclei with I= 1 in a Magnetic Field number of states = 2I+1
Boltzmann Distribution of Spin States • In a given sample of a specific nucleus, the nuclei will be distributed throughout the various spin states available. Because the energy separation between these states is comparatively small, energy from thermal collisions is sufficient to place many nuclei into higher energy spin states. The numbers of nuclei in each spin state are described by the Boltzman distribution
Boltzman distribution • where the N values are the numbers of nuclei in the respective spin states, is the magnetogyric ratio, h is Planck's constant, H(B) is the external magnetic field strength, k is the Boltzmann constant, and T is the temperature. • In NMR, the energy separation of the spin states is comparatively very small and while NMR is very informative it is considered to be an insensitive technique .
Example: Boltzman distribution • For example, given a sample of 1H nuclei in an external magnetic field of 1.41 Tesla • ratio of populations = e((-2.67519x10e8 rad.s-1.T-1 * 1.41T * 6.626176x10-34 J.s) / (1.380662x10e-23 J.K-1 *K 293)) = 0.9999382 • At room temperature, the ratio of the upper to lower energy populations is 0.9999382. In other words, the upper and lower energy spin states are almost equally populated with only a very small excess in the lower energy state. • If N0= 106 or 1,000,000then Nj 999,938 • N0- Nj =1,000,000 – 999,938 = 62 • 62 ppm excess in the ground state
Saturation • The condition that exists when the upper and lower energy states of nuclei are equal. (no observed signal by NMR)
Electron Spin Resonance SpectroscopyESR ESR or Electron Paramagnetic Resonance (EPR) Spectroscopy Provides information about the electronic and molecular structure of paramagnetic metal centers. Measurement of the spin state, S, the magnitude of hyperfine interactions with metal and ligand nuclei, and the zero-field splitting of half-integer S > 1/2 electronic states, allows a researcher to identify the paramagnetic center, and to potentially identify ligating atoms. • Nuclear hyperfine coupling constants
ESR Spectroscopy Uses microwave radiation on species that contain unpaired electrons placed ina magnetic fieled • Free radicals • Odd electron molecules • Transition-metal complexes • Lanthanide ions • Triplet-state molecules
ESR of Mn2+ • Mn2+ is d5 term symbol is D ( -3,-2,-1,0,+1,+2,+3) ML = ± 1 five main spin transitions due to the D term. Hyperfine interaction each of these lines is in turn split into six components (the Mn2+ nuclear spin is I = 5/2) (2I+1)
Electron Spin Resonance SpectroscopyESR • A magnetic field splits the MS = ±1/2 spin states into two energy levels, separated by. Because of the difference in mass of p+ and e-, a given field B will • split the electron states about 2000-fold further than the proton states. Since the signal intensity of magnetic resonance techniques is directly proportional to the difference in the two populations, EPR is intrinsically more sensitive Than NMR (other things being equal).
The macroscopic view • The NMR experiment measures a largenumber of spins derived from a huge number of molecules. Therefore, we now look at the macroscopic bevaviour. • The sum of the dipole moments of all nuclei is called magnetization. In equilibrium the spins of I=1/2 nuclei are either in the a or b-state and precess about the axis of the static magnetic field. However, their phases are not correlated. • For each vector pointing in one direction of the transverse plane a corresponding vector can be found which points into the opposite direction:
Bulk magnetization (Mo) Now consider a real sample containing numerous nuclear spins: Mo%(Na - Nb) m = mxi + myj +mzk z z Mo x x y y Bo Bo Since m is precessing in the xy-plane, Mo = ∑mzk – m-zk m is quantized (a or b), Mo has a continuous number of states, bulk property.
An NMR Experiment We have a net magnetization precessing about Bo at a frequency of wo with a net population difference between aligned and unaligned spins. z z Mo x x y y Bo Bo Now What? Perturbed the spin population or perform spin gymnastics Basic principal of NMR experiments
An NMR Experiment To perturbed the spin population need the system to absorb energy. z Mo x B1 Bo y i Transmitter coil (y) Two ways to look at the situation: (1) quantum – absorb energy equal to difference in spin states (2) classical - perturb Mo from an excited field B1
An NMR Experiment resonant condition: frequency (w1) of B1 matches Larmor frequency (wo) energy is absorbed and population of a and b states are perturbed. z z Mo B1 off… (or off-resonance) x x B1 Mxy w1 y y w1 And/Or: Mo now precesses about B1 (similar to Bo) for as long as the B1 field is applied. Again, keep in mind that individual spins flipped up or down (a single quanta), but Mo can have a continuous variation. Right-hand rule
An NMR Experiment What Happens Next? The B1 field is turned off and Mxy continues to precess about Bo at frequency wo. z x wo Mxy y NMR signal Receiver coil (x) FID – Free Induction Decay The oscillation of Mxy generates a fluctuating magnetic field which can be used to generate a current in a receiver coil to detect the NMR signal.
NMR Signal Detection - FID Mxy is precessing about z-axis in the x-y plane Time (s) y y y The FID reflects the change in the magnitude of Mxy as the signal is changing relative to the receiver along the y-axis Again, it is precessing at its Larmor Frequency (wo).
NMR Relaxation Related to line-shape Mx = My = M0 exp(-t/T2) (derived from Hisenberg uncertainty principal) T2 is the spin-spin (or transverse) relaxation time constant. In general: T1 T2 Think of T2 as the “randomization” of spins in the x,y-plane Please Note: Line shape is also affected by the magnetic fields homogeneity
NMR Signal Detection - Fourier Transform So, the NMR signal is collected in the Time - domain But, we prefer the frequency domain. Fourier Transform is a mathematical procedure that transforms time domain data into frequency domain
Laboratory Frame vs. Rotating Frame To simplify analysis we convert to the rotating frame. z z x x Mxy Mxy wo Bo y y Laboratory Frame Rotating Frame Simply, our axis now rotates at the Larmor Freguency (wo). In the absent of any other factors, Mxy will stay on the x-axis All further analysis will use the rotating frame.
Continuous Wave (CW) vs. Pulse/Fourier Transform NMR Sensitivity Issue A frequency sweep (CW) to identify resonance is very slow (1-10 min.) Step through each individual frequency. Pulsed/FT collect all frequencies at once in time domain, fast (N x 1-10 sec) Increase signal-to-noise (S/N) by collecting multiple copies of FID and averaging signal. S/N number of scans
NMR Pulse A radiofrequency pulse is a combination of a wave (cosine) of frequency wo and a step function * = tp Pulse length (time, tp) The fourier transform indicates the pulse covers a range of frequencies FT Hisenberg Uncertainty principal again: Du.Dt ~ 1/2p Shorter pulse length – larger frequency envelope Longer pulse length – selective/smaller frequency envelope Sweep Width f ~ 1/t
NMR Pulse NMR pulse length or Tip angle (tp) z z qt Mo tp x x B1 Mxy y y qt = g * tp * B1 The length of time the B1 field is on => torque on bulk magnetization (B1) A measured quantity – instrument dependent.
NMR Pulse Some useful common pulses z z 90o pulse Mo p / 2 Maximizes signal in x,y-plane where NMR signal detected x x Mxy 90o y y z z 180o pulse Inverts the spin-population. No NMR signal detected Mo p x x 180o -Mo y y Can generate just about any pulse width desired.
NMR Data Acquisition Collect Digital Data ADC – analog to digital converter The Nyquist Theorem says that we have to sample at least twice as fast as the fastest (higher frequency) signal. Sample Rate - Correct rate, correct frequency SR = 1 / (2 * SW) • ½ correct rate, ½ correct frequency Folded peaks! • Wrong phase! SR – sampling rate
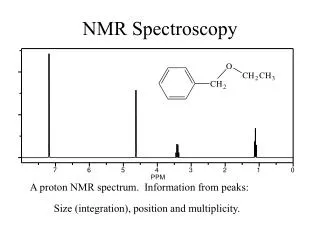
g-rays x-rays UV VIS IR m-wave radio 10-10 10-8 10-6 10-4 10-2 100 102 wavelength (cm) Information in a NMR Spectra 1) Energy E = hu h is Planck constant u is NMR resonance frequency ObservableNameQuantitativeInformation Peak position Chemical shifts (d) d(ppm) = uobs –uref/uref (Hz)chemical (electronic) environment of nucleus Peak Splitting Coupling Constant (J) Hz peak separation neighboring nuclei (intensity ratios) (torsion angles) Peak Intensity Integral unitless (ratio) nuclear count (ratio) relative height of integral curve T1 dependent Peak Shape Line width Du = 1/pT2 molecular motion peak half-height chemical exchange uncertainty principal uncertainty in energy
NMR Sensitivity • NMR signal depends on: • Number of Nuclei (N) (limited to field homogeneity and filling factor) • Gyromagnetic ratio (in practice g3) • Inversely to temperature (T) • External magnetic field (Bo2/3, in practice, homogeneity) • B12 exciting field strength signal (s) g4Bo2NB1g(u)/T Na / Nb = e DE / kT DE = g hBo /2p Increase energy gap -> Increase population difference -> Increase NMR signal ≡ ≡ DE g Bo g - Intrinsic property of nucleus can not be changed. (gH/gN)3for 15N is 1000x (gH/gC)3for 13C is 64x 1H is ~ 64x as sensitive as 13C and 1000x as sensitive as 15N ! Consider that the natural abundance of 13C is 1.1% and 15N is 0.37% relative sensitivity increases to ~6,400x and ~2.7x10⁵x !!
How NMR is achieved • Liq N2 Liq He Magnet
Instrument and Experimental Aspects • Sample Preparation, • Standards, • The probe, Probe • Tuning and Matching, • Locking, and Shimming.
Nuclear Magnetic Resonance • Sample Preparation NMR samples are prepared and run in 5 mm glass NMR tubes. Always fill your NMR tubes to the same height with lock solvent Deuteron resonance serves as lock- signal for the stabilisation of the spectrometer magnetic fieled.
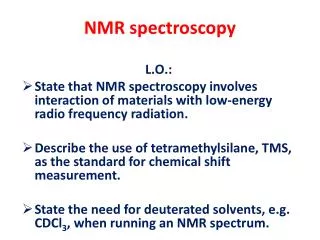
Common NMR solvents • Acetone- d6 Ethanole- d6 Acetonitrile- d3 • Formic acid- d2 Benzene- d6 Methanole- d4 • Chloroform- d1 Nitromethane- d3 Deuteriumoxide-D2O • Pyridine- d5 Dichloromethane- d2 1,1,2,2- Tetrachloroethane- d2 Dimethylformamide- d7 Tetrahydrofurane- d8 Dimethylsulfoxide- d6 • Toluene- d8 1,4- Dioxane- d8 Trifluoroacetic acid- d1 • NMR solvents are used as reference peaks • to adjust the ppm values in the spectrum • relative to TMS (tetramethyl silane)
NMR probes • NMR probes designed creating different radio frequency singnals and detectors for dealing with varuous magnetic nuclie have become more advanced and allow progressively smaller samples. Probe diameters and correspondingly sample volumes have progressively decreased. • 1H NMR Probe High frequency ( 270 MHz)probes • 19F NMR Probe High frequency (254 MHz) probes • 13C NMR Probe Low frequncy(< 254 MHz) probes • Broad band probe High/Low frequency tunable probes
NMR Spectra Terminology TMS CHCl3 7.27 0 ppm increasing d decreasing d low field high field down field up field high frequency (u) low frequency de-shielding high shielding Paramagnetic diamagnetic 600 MHz 150 MHz 92 MHz 1H 13C 2H Increasing field (Bo) Increasing frequency (u) Increasing g Increasing energy (E, consistent with UV/IR)
Shielding and Deshielding of Nuclei • The magnetic field at the nucleus, B, (the effective field) is therefore generally less than the applied field, Bo, by a fraction . • B = Bo (1-s) • peaks move to right due to shileding • peaks move to left due to deshileding: beeing attached more electronegitve atoms or experiencing ring currents as in benezne
Chemical Shift • The chemical shift of a nucleus is the difference between the resonance frequency of the nucleus and a standard, relative to the • standard. This quantity is reported in ppm and given the symbol delta, d. • d = (n - nREF) x106 / nREF