Download

1 / 37
370 likes | 392 Views
This article discusses the regional verification of the Climate Prediction Center's seasonal outlooks, including outlook categories, probabilities, and verification methods. It also provides examples of skill scores and data from past forecasts. The article concludes with an overview of forecast tools and a summary of the 2004-2005 outlook.

E N D
Regional Verification of CPC’sSeasonal Outlooks Michael Halpert & Kenneth Pelman Climate Prediction Center
Seasonal Outlook Schedule/Leads • Each month, near mid-month CPC prepares a set of 13 outlooks for 3-month “seasons” (any set of 3 adjacent months) for lead times ranging from ½ month, 1 ½ months, 2 ½ months, 3 ½ months, …, 12 ½ months. • The outlook for each successive/prior lead time overlaps the prior/successive one by 2 months. This overlap makes for a smooth variation from one map to the next.
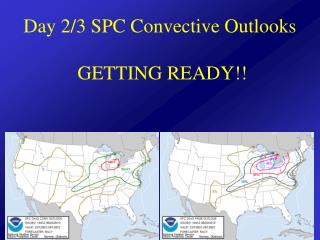
Outlook Categories and Probabilities • Seasonal outlooks are prepared for average temperature and total accumulated precipitation category • Three categories are used (terciles). These are BELOW-,NEAR- and ABOVE-normal (median), for temperature (precipitation). • Regions where the likelihoods of the three categories are the same (33.33…% each) are designated as “EC”, for equal chances. • In non-EC regions the labels on the contours give the total probability of the dominant category.
Verification • Heidke Skill Score • H=[ ( NC – CH)/(NT – CH) ] * 100 • H=Heidke Skill Score • NC = total number of correct forecasts by station • NT = total number of forecasts made by station • CH = number of correct forecasts, by chance • In 3 class system, scores range from -50 to +100
Verification • Examples • a. 99 stations, 50 correct forecasts • H = [(50-33)/(99-33)] *100 = 25.8 • b. 51 stations, 12 correct • H = [(12-17)/(51-17)]*100 = -14.7 • c. 45 stations, 35 correct • H=[(35-15)/(45-15)*100 = 66.7
Data 9+ years of seasonal forecasts JFM 1995 – AMJ 2004 112 Total Forecasts Winter: NDJ – JFM (28) Spring: FMA – AMJ (30) Summer: MJJ – JAS (27) Fall: ASO – OND (27)
Temperature – By Season Spring Winter Summer Fall
Temperature – By Category (All) Below Above
Temperature - Category DJF&MAM Winter/Below Winter/Above Spring/Above Spring/Below
Temperature - Category JJA&SON Summer/Below Summer/Above Fall/Above Fall/Below
Temperature Summary (Official) • Good skill from the Pacific NW, peaking in the SW and extending through the South. • No skill in N. Plains, Great Lakes, NE • Winter forecasts best, Fall poorest • No skill in NE, always skill in SW • All skill comes from above normal; negative skill everywhere for below
Forecast Tools • Optimal Climate Normal (OCN) • Canoncial Correlation Analysis (CCA) • Coupled Model (CMP) • Screened Multiple Linear Regression (SMLR)
Temperature – OCN/CCA All CCA OCN
Temperature – OCN/CCA By Category OCN/Above OCN/Below CCA/Above CCA/Below
Temperature – SMLR/CMP All CMP SMLR
Temperature – SMLR/CMP By Category SMLR/Above SMLR/Below CMP/Above CMP/Below
Forecast Tools - DJF CCA OCN SMT CMP
Forecast Tools - MAM CCA OCN SMT CMP
Forecast Tools - JJA CCA OCN SMT CMP
Forecast Tools - SON CCA OCN SMT CMP
Precipitation – By Season Spring Winter Summer Fall
Precipitation – By Category (All) Below Above
Precipitation - Category DJF&MAM Winter/Below Winter/Above Spring/Above Spring/Below
Precipitation - Category JJA&SON Summer/Below Summer/Above Fall/Above Fall/Below
Precipitation Summary (Official) • Skill in West, South and NE (few cases) • Skillful regions vary by season • Skill in all seasons in NW, except Spring • Skillful forecasts for both above and below in the SW and along Gulf Coast, FL • Skill for winter/spring forecasts for below in South, only along Gulf Coast for above
Precipitation – OCN/CCA All OCN CCA
Precipitation – OCN/CCA By Category OCN/Above OCN/Below CCA/Above CCA/Below
Precipitation – SMLR/CMP All CMP SMLR
Precipitation – SMLR/CMP By Category CMP/Above CMP/Below SMLR/Above SMLR/Below
Forecast Tools - DJF CCA OCN SMT CMP
Forecast Tools - MAM CCA OCN SMT CMP
Forecast Tools - JJA CCA OCN SMT CMP
Forecast Tools - SON CCA OCN SMT CMP