Download
1 / 34
390 likes | 692 Views
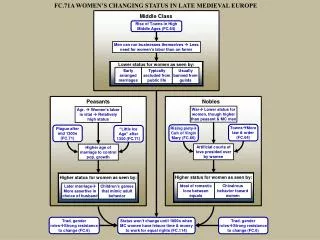
Background: The status of women in academia. Percent of faculty who are women decreases with rank Few women in positions of leadership Little change in these numbers in last 2 decades, despite increase in women “feeding” into the system The MIT experience

E N D
Background: The status of women in academia • Percent of faculty who are women decreases with rank • Few women in positions of leadership • Little change in these numbers in last 2 decades, despite increase in women “feeding” into the system • The MIT experience • Women professors receive lower salaries, less lab space, and other resources • Institutional admission of unintended gender discrimination, as well as implementing solutions Science 1999; 286: 1272-78
Gender Equity Projects at the University of Arizona • The Millennium Project (campus wide, commissioned by President Likins) • Dean’s Committee on Women Faculty (College of Medicine with representatives from each department) • Initiated the GRACE (Generating Respect for All in a Climate of academic Excellence) research project • Objectives: To investigate causes of, and implement solutions to, gender disparities in track assignment, promotion, salary, and leadership positions at the COM
Hypothesis driven research • Institutional barriers • Women are given equal credit for their achievements, and have equal access to resources. • Promotion • The proportion of women at higher ranks reflects the “pool” of available women. • Women are less career oriented than men. • Leadership • Women lack the requisite skills and desire to lead. • Discrimination • Discrimination rarely occurs, and is effectively addressed.
GRACE project data sources • Institutional data on rank and salary • CVs for publication data (90%) • Survey data (48%) • On-line survey for COM/COPH faculty on leadership, resources, support, treatment, communication • Qualitative data • Open-ended interviews (n=54) with random sample of women and men stratified by track, rank, type of department
Hypothesis #1: The distribution of rewards and resources at the COM is gender blind • Analyzed total salary (including bonus) for 1999-2000 • Appointed Personnel Office’s database • Faculty (n=413): • Primary appointment in COM, located in Tucson • 50% FTE • Tenure, clinical suffix, or research track
Analysis of salary data • Data were log-transformed to remove effect of outliers • Used Analysis of Variance to adjust for: • rank • years at that rank • track • degree (MD, PhD) • “specialty” (basic science, generalist, non-surgical specialty, surgical specialty) • administrative responsibilities (section or division head, department or center head)
Additional adjustment for measures of productivity • Total number of peer-reviewed publications (based on CVs) • Clinical revenues (for clinical faculty; data from UPI)
The facts (a):Adjusted mean salary, by gender, and deficit for women
Mean gender difference in adjusted salary, by department Basic Science Depts. Clinical Depts. * ** ** * ** * p<.10 ** p<.05
The facts (b): Credit and resources • Women are less likely to feel that they are given appropriate credit for their work (1-6 scale, 6 as “always”: women - 4.2, men - 4.5; p<.06). • Female full professors at the COM are significantly more likely than male full professors to share their research space (women - 73%, men - 40%; p<.05).
Hypothesis #1: The reality Women at the COM are less likely to be rewarded for their work, in terms of salary, recognition, and research space.
Female (n=116) Male (n=297) Gender distribution by rank, UA COM
Female (n=116) Male (n=297) Gender distribution by track, UA COM
Number of males and females at each rank, by track, UA COM Research/Clinical Tenure Assistant Assistant
Hypothesis #2: The distribution of women in the COM reflects the pool of available women The facts: The percent of women assistant professors being promoted to associate or full professors, in colleges of medicine, nationally, declines over time.
Facts: Percent female and male faculty, by rank, US, 1989 & 1999 1989 1999
Hypothesis #2: The reality The lack of women at higher ranks can not be explained solely by a pipeline effect.
Hypothesis #3: Women are less career-oriented, due to family and other commitments The facts (a) • There are no reported differences between women and men in: • The importance of career • The desire to balance work and family life • Delay of tenure clock (among tenure track faculty) • Number of publications (after adjusting for rank, track, degree)
Despite the lack of gender differences in productivity or reported commitment: The facts (b) • Mean years to promotion to associate professor greater for women than men (6.5 vs. 5.2, p<.01). • This difference is borderline significant when adjusted for track, publications (6.0 vs.5.2 years for men, p<.09). • Women on the tenure track more likely to have considered changing tracks (46% vs. 9%, p<.00001).
Hypothesis #3: The reality Whatever their other commitments, women and men at the COM are equally productive and equally committed to their careers. Despite these similarities, significantly fewer women are full professors.
Leadership at COM (1999-2000) MenWomen Department heads (n=19) 100% 0% Section heads (n=36) 89% 11%
Hypothesis #4: Women don’t have the “right stuff” to be leaders The facts (a) There were no gender differences in: • aspiring to lead (61% vs 57% of men) • self-assessment as having leadership qualities (91% vs. 94%) • being somewhat or very willing to take on time consuming tasks (73% vs. 79%) • feeling undermined in a leadership role (42% vs. 44%)
The facts (b): Women were less likely to: • Be asked to serve • as committee chair (48% vs. 68%, p<.001) • as section head (12% vs. 45 %, p<.001) • as department head (6% vs. 25%, p<.001) • Be involved in • decisions over promotion • decisions over non-grant supported space • Feel they have influence in the department
Hypothesis #4: The reality Women in the COM are willing and able to lead but their leadership abilities are not recognized, and they are not asked to lead.
Hypothesis #5: There are no gender differences in treatment at the COM The facts Women felt their department treated faculty differently based on gender at least some of the time (54% vs. 21%, p<.00001). Women were significantly more likely to report they had been discriminated against (32% vs. 5%, p<.00001). Only 7% of the women citing discrimination sought recourse. Most women stated that the COM does not respond appropriately to charges of discrimination (68% vs. 15%, p<.00001). Women were less likely to feel they “fit in” (72% vs 85%, p<.03).
Summary (I): Gender differences in at the College of Medicine • The dearth of women at higher ranks is not due to a “pipeline” problem, or to differences in commitment or productivity. • Women are less likely than men to be recognized or rewarded, with research space or salary, for their accomplishments.
Summary (II): Gender differences in at the College of Medicine • Women are interested in, and capable of, taking on leadership positions, but are rarely given the opportunity. • Most women faculty in the COM feel their departments treat men and women differently. • Discrimination against female faculty is common, and few faculty feel the COM adequately addresses discrimination.
The next steps: Identifying and implementing solutions • Overall goal: Create a culture that attracts and retains the most talented women faculty. • Continue discussions with Faculty, Department Heads, and administration about possible solutions. • Literature review of solutions used elsewhere and in other disciplines • Propose solutions in September, 2001, simultaneously with the Millennium Project
Examples of possible solutions • Continue to monitor status of women in the COM • Measure (and reward) improvements in each Department for: • increasing proportion of women promoted, on tenure track • successfully recruiting and retaining women faculty • eliminating salary differentials • appointing qualified women to leadership positions • Creation of an advisory committee on women’s status to review progress, and to advise on appropriate solutions • Develop innovative programs that will attract funding
GRACE Project web address http://www.medicine.arizona.edu/grace.html Survey results Activities Contact information References
Clinical Science Basic Science Rank Departments Departments Assistant - $ 9,648 * $ 5,181 Associate - $ 11,599 - $ 8,250 * Full Professors - $ 34,133 * - $ 23,976 ** P value: *<.05, **<.001 Gender differences in salary by rank and department type
Lifetime salary differential if receive average female salary If 6 years as assistant professor, If 6 years as associate professor, If 13 years as full professor, Lifetime difference in income due to gender: Clinical departmentsBasic science departments $571,211 $ 330,102
Salary data log-transformed to reduce effect of outliers Log Salary Salary Number of Individuals