Download
1 / 56
570 likes | 801 Views
The Braidwood Neutrino Experiment. Ed Blucher, Chicago. Outstanding questions in neutrino oscillation physics: importance of 13 Experimental approaches to 13 ; motivation for a precise reactor experiment The Braidwood Experiment. Neutrino Oscillations.

E N D
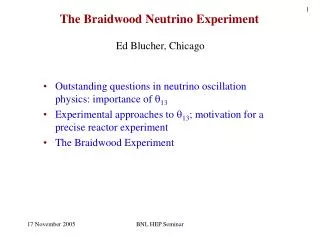
The Braidwood Neutrino Experiment Ed Blucher, Chicago • Outstanding questions in neutrino oscillation physics: importance of 13 • Experimental approaches to 13; motivation for a precise reactor experiment • The Braidwood Experiment BNL HEP Seminar
Neutrino Oscillations During last few years, oscillations among different flavors of neutrinos have been established; physics beyond the S.M. Mass eigenstates and flavor eigenstates are not the same: mass eigenstates flavor eigenstates MNSP matrix • Raises many interesting questions including possibility of CP violation in neutrino oscillations. • CP violation in neutrino sector could be responsible for the matter-antimatter asymmetry (leptogenesis) The antilepton excess is converted to a baryon excess through nonperturbative S.M. B+L violating, but B-L conserving processes.
2-Flavor Neutrino Mixing The time evolution of the flavor states is: For a beam that is pure at t=0,
What do we know? Oscillations established with two distinct mass differences 1. Atmospheric: m2~2.5 eV2 Experiments using neutrinos produced by cosmic rays in atmosphere (e.g., SuperK); verified with long-baseline accelerator experiment (K2K). K2K Super Kamiokande
2. Solar: m2~55 eV2 Series of experiments using neutrinos from the Sun (e.g., Ray Davis 37Cl experiment, SNO) and KAMLAND experiment using reactors in Japan. Ray Davis SNO KAMLAND
What about LSND? Unconfirmed observation of oscillations with m2~1 eV2by LSND does not fit into 3 generation model (with 2 independent mass splittings). MiniBoone should have results early next year.
Neutrino mixing and masses 12 ~ 30° 23 ~ 45° sin2 213 < 0.15 at 90% CL What is e component of 3 mass eigenstate? normal inverted
Key questions in neutrino mixing • What is value of 13? • What is mass hierarchy? • Do neutrino oscillations violate CP symmetry? • Why are quark and neutrino mixing matrices so different? Value of 3 central to these questions; it sets the scale for experiments needed to resolve mass hierarchy and search for CP violation.
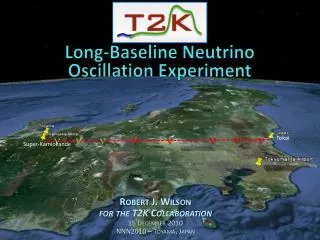
Methods to measure sin2213 • Accelerators: Appearance (e) at m22.510-3 eV2 T2K: <E> = 0.7 GeV, L = 295 km NOA:<E> = 2.3 GeV, L = 810 km • Reactors: Disappearance (ee) at m22.510-3 eV2 • Use reactors as a source of e (<E>~3.5 MeV) with a detector 1-2 kms away • and look for non-1/r2 behavior of the e rate Reactor experiments provide the only clean measurement of sin22: no matter effects, no CP violation, almost no correlation with other parameters.
Recommendation 2 (of 3): • We recommend, as a high priority, a comprehensive U.S. program to complete • our understanding of neutrino mixing, to determine the character of the neutrino • mass spectrum, and to search for CP violation among neutrinos. This program • should have the following components: • An expeditiously deployed multi-detector reactor experiment with sensitivity to • disappearance down to sin22 = 0.01, an order of magnitude below present • limits. • A timely accelerator experiment with comparable sin22 = 0.01 sensitivity and • sensitivity to the mass hierarchy through matter effects. • A proton driver in the megawatt class or above and neutrino superbeam with an • appropriate very large detector capable of observing CP violation and measuring • the neutrino mass-squared differences and mixing parameters with high precision.
Both reactor and accelerator experiments have sensitivity to sin22, but accelerator measurements have ambiguities Example: T2K. P(e)=0.0045 sin2213=0.028 dcp • normal • inverted (5 yr n) +/- 0.028 m2=2.510-3 eV2
90% CL allowed regions with osc.signal Reactor and accelerator sensitivities to sin22 90% CL exluded regions with no osc.signal Braidwood sin22θ13 = 0.05, δCP=0, Δm2 = 2.5×10⁻³ eV2 (3 yr reactor, 5 yr T2K) δCP=0, Δm2 = 2.5×10⁻³ eV2 (3 yr reactor, 5 yr Nova)
Resolving the 23 Degeneracy 90% CL Braidwood (3 yrs) + Nova Nova only (3yr + 3yr) Double Chooz (3yrs) + Nova Green: Nova OnlyBlue: Braidwood Reactor plus Nova Red: Double-Chooz plus offaxis • disappearance experiments • measure sin2223, while • P(e)sin223sin2213. • If 2345, disappearance • experiments, leave a 2-fold • degeneracy in 23 – it can be • resolved by combination of a • reactor and e appearance • experiment. Example: sin22 23 = 0.95 0.01 Δm2 = 2.5×10⁻³ eV2 sin2213 = 0.05 Δm2 = 2.5×10⁻³ eV2sin22q13 = 0.05
CP Violation and the Mass Hierarchy T2K Nova P(e) sin2213=0.1 CP CP
Example: Reactor + T2K running T2K - 5 years sin22=0.01 from reactor P(e) sin2213=0.1 Neutrino, normal hierarchy Neutrino, inverted hierarchy CP
Nova and T2K Sensitivity to CP and Mass Hierarchy If Braidwood does not see an oscillation signal, it will be difficult for long-baseline “superbeam” experiments to investigate mass hierarchy and CP violation.
Reactor Measurements of Neutrino Oscillations Reactors are copious sources of per second. Flux Cross section Detection of antineutrino by (~100 events /GW/ yr / ton at L= 1500 m)
Reactor Measurements of 13: Search for small oscillations at 1-2 km distance (corresponding to Past measurements: Pee Our sensitivity goal: sin22~0.01. Level at which long-baseline accelerator experiments can be used to measure mass hierarchy, CP violation. Distance to reactor (m)
Chooz: Current Best Experiment P=8.4 GWth L=1.05 km D=300mwe m = 5 tons, Gd-loaded liquid scintillator sin22< 0.15 for m2=2.5103 eV2
~200 m ~1300 m • How to improve on previous reactor experiments? • Add an identical near detector • Eliminate dependence on reactor flux; only relative • acceptance of detectors needed Optimize baseline (1500 m) Larger detectors (5 ton 100 tons) Reduce backgrounds (Go deeper 100m 150 to 300 m; active veto systems)
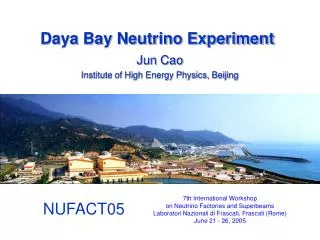
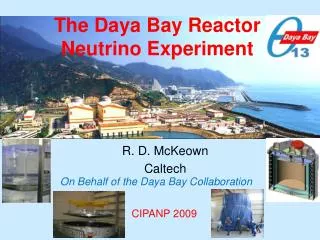
Many sites have been discussed: • Kraznoyarsk (Russia) • Chooz (France) • Kashiwazaki (Japan) • Diablo Canyon (California) • Braidwood, Byron (Illinois) • Wolf Creek (Kansas) • Brazil • Taiwan • Daya Bay (China)
Kr2Det: Reactor 13 Experiment at Krasnoyarsk ~20000 ev/year ~1.5 x 10⁶ ev/year Features - underground reactor - existing infrastructure Detector locations constrained by existing infrastructure Reactor Ref: Marteyamov et al, hep-ex/0211070
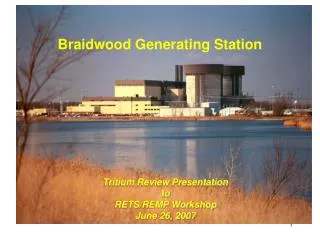
Braidwood BraidwoodNeutrino Experiment • Features of Braidwood Site: • 23.6 GW reactors – 7.17 GW maximum power • Flat: flexibility, equal overburden at near and far sites, surface • transportation of detectors • Favorable geology (dolomitic limestone): good for excavation, • low radioactivity (order of magnitude lower U, Th than granite)
The Braidwood Collaboration 14 Institutions 70 Collaborators
Braidwood Baseline Design • Goals: Flexibility, redundancy, cross checks • 4 identical 65 ton fiducial mass detectors; 2 at near site (L=270m), 2 at far site (L=1510m) • “Two zone detectors”: inner zone with Gd-loaded LS and r=2.6 m; outer zone with mineral oil and r=3.5 m. • Movable detectors with surface transport for cross-calibration; vertical shaft access to detector halls • Oscillation measurements using both rate and energy spectrum • Full detector construction above ground; detectors • filled simultaneously with common scintillator. • Near and far detectors at same depth of 183 (464 mwe) gives equal spallation rates that can be exploited for detector and background checks
Braidwood Site Far Detector Near Detector
Bore Hole Project at the Exelon Site Bore hole project completed in January 2005 • Bore holes drilled to full depth (200m) at near and far shaft positions on Braidwood site. • Provided detailed information on geology, ground water, radioactivity, etc. • Confirmed feasibility of detectors down to depths of 460mwe. • Reduces contingency required for underground construction • Demonstrated willingness of Exelon to allow construction on their site.
Braidwood Design Sensitivity GOALS: • Discovery potential (at 3) for sin2213 > 0.01 • Sensitivity (90% CL) down to the sin2213 = 0.005 level With cross checks and redundancy to establish signal and check systematic errors • See signal in both rate and energy spectrum measurements • Cross calibrate detector pairs at high-rate near site • Cross calibrate near/far detectors using spallation isotopes like 12B • Multiple near and far detectors give direct crosschecks on detector systematics at 0.05% for the near set and 0.3% for far • Large detectors allow studies of the radial dependence of the IBD signal and backgrounds.
Normalization and spectral information • Counting analysis: Compare number • of events in near and far detector • Systematic uncertainties: • relative normalization of near and • far detectors • relatively insensitive to energy • calibration • Energy spectrum analysis: Compare • energy distribution in near and far • detectors • Systematic uncertainties: • energy scale and linearity • insensitive to relative efficiency of • detectors Predicted spectrum 13=0 (from near detector) Observed spectrum (far detector) sin2213=0.04 E (MeV) E (MeV)
e+ e n Detectors and analysis strategy designed to minimize relative acceptance differences Central zone with Gd-loaded scintillator surrounded by buffer regions; fiducial mass determined by volume of Gd-loaded scintillator Events selected based on coincidence of e+ signal (Evis>0.5 MeV) and s released from n+Gd capture (Evis>6 MeV). No explicit requirement on reconstructed event position; little sensitivity to E requirements. Shielding Neutrino detection by nmGd → m+1Gds (8 MeV); =20sec 6 meters Gd-loaded liquid scintillator To reduce backgrounds: depth + active and passive shielding
Conceptual Mechanical Design • Outer steel buffer oil containment vessel (7m diameter) • 1000 low activity glass 8” PMTs evenly distributed on inside surface (25% coverage) • Inner acrylic Gd-loaded scinitillator containment vessel (5.2m diameter) • Top access port can be used to insert calibration sources
Acceptance Issues Must know: (relative) number of protons in fiducial region (relative) efficiency for detecting IBD events Known volume of stable, identical Gd-loaded liquid scintillator in each detector Well understood efficiency of positron and neutron energy requirements
Reconstructed Positron Energy ~E 0.8 MeV Reconstructed NeutronCapture Energy Monte Carlo Studies Reconstructed e+ and n-capture energy Studies based on hit-level simulation with parameterizations of many detector effects. Studies using full GEANT4 simulation are underway. n Capture on Gd • Reconstructed Energy Cuts: • positron: Evis > 0.5 MeV • n-Gd capture: Evis > 6 MeV n Capture on H
Energy Scale Calibration fromneutron capture peaks 0.1%uncertainty Use neutron capture peaks from IBD events to measure energy scale. In each far detector, E scale can be measured to 0.3% every 5 days. (This calibration averages over detector in exactly the same way as signal events.) Acceptance uncertainty from energy scale should be ~0.1%.
I II III 3-zone versus 2-zone detectors I. Gd-loaded liquid scintillator II. catcher: liquid scintillator (no Gd) III. Non-scintillating buffer (Braidwood 2-zone Design)
Gd - Liquid Scintillator (Gd-LS) • Detectors must be filled simultaneously common scintillator; relative volume measurement with <0.2% uncertainty. • We plan to use 0.2% Gd + 20% PC + 80% dodecane mixture developed by BNL Nuclear Chemistry group. (Dick Hahn, Minfeng Yeh, et al.) • Long-term stability tests in progress • So far, stable with attenuation length > 18 m. Stability of Gd-LS (Absorbance of 0.002 corresponds to attenuation Length of ~20 m). Chooz degradation was 0.4%/day x - Braidwood scintillator
Transport is necessary to move detectors from construction/filling area to below ground halls Movable detectors allow direct check of relative detector acceptances at near site Possible scenario: Possible method: Use climbing jack system with cable to lift and put detectors on multi-wheeled trailer (standard method used in industry). Movable Detectors A B B C D A D A B C Goldhofer Trailer Moving 400 tons
Using Isotope Production to Measure Fiducial Mass Beta decays t1/2 = 20ms (can tag to muon) 13.4 MeV endpoint 12B • Unique feature of the Braidwood site: Near and far detectors have equal, well-understood, substantial overburden Can use produced 12B events to measure: • Near/far relative target mass from the total rate • Near/far energy calibrations from the relative energy distribution • ~50,000 12B beta-decay events per year per detector can be tagged and isolated giving a statistical uncertainty of 0.45% • Systematic uncertainties related to the knowledge of relative near/far overburden; must be known to few percent from: • Geological survey information (Bore hole data: near/far agreement <1%) • Cosmic muon rates in the near and far locations
Backgrounds Even though near and far shielding is the same, backgrounds do not cancel: signal/background ratios in the near and far detectors are different. • Uncorrelated backgrounds from random coincidences (not a problem) • Reduced by limiting radioactive materials • Limestone rock at Braidwood site has low radioactivity • Directly measured from rates and random trigger setups • Correlated backgrounds • Neutrons that mimic the coincidence signal • Cosmogenically produced isotopes that decay to a beta and neutron (9Li and 8He).
Cosmic Muon Rates at Braidwood Depths • Calculation of muon rate at 464 mwe (600 ft) • Used data from boreholes for density and material • Average muon flux = 0.213 /m2/sec • Average muon energy = 110.1 GeV
Veto Detectors p n n m m Veto (Tagging) System Goal: < 1 n background event/day/detector. Strategy: tag muons that pass near the detector. Use shielding to absorb neutrons produced by muons that miss the veto system. • Residual n background: • Veto inefficiency ─ 99% efficiency → 0.25/detector/day • Fast neutron created outside the shielding ─ 0.5/detector/day Shielding With μrate in the veto system of 21 Hz and the tag window of 100 μs → 0.2% dead time 6 meters Muon identification must allow in situ determination of the residual background rate
For a veto system with 2 mwe of shielding, both a GEANT4 and a MARS calculation give: 170 n/ton/day produced in the surrounding rock 4500 n/day emerging from the rock Background rate of ~0.75 events/ dayafter the veto requirements Background Simulations Neutrons that reach the vessel wall Fraction of Neutrons Detector Untaggedneutrons
9Li and 8He Isotopes like 9Li and 8He can be created in μ spallation on 12C and can decay to β+n. Long lifetimes make veto difficult: 9Li~178ms KAMLAND found isotope production correlated with muons that shower in the detector. from the thesis of Kevin McKinny Tagging showering muons and rejecting events in a 0.5 s window eliminates 72% of 9Li and results in7% deadtime. Expect 0.078 9Li/ton/day; half decay in β+n modes; 72% are tagged 0.7/detector/day. More…
Background Summary Compare to 160 signal/detector/day at the far site (S/N~85)