Download
1 / 36
380 likes | 572 Views
Structural Health Monitoring Based on Empirical Mode Decomposition and the Hilbert Transform. Feng Yan Master of Science Candidate Department of Mechanical and Aeronautical Engineering Clarkson University, Potsdam, NY. Examining Committee Dr. Ratneshwar Jha (Advisor, Dept. of MAE)

E N D
Structural Health Monitoring Based on Empirical Mode Decomposition and the Hilbert Transform Feng Yan Master of Science Candidate Department of Mechanical and Aeronautical Engineering Clarkson University, Potsdam, NY Examining Committee Dr. Ratneshwar Jha (Advisor, Dept. of MAE) Dr. Goodarz Ahmadi (Co-advisor, Dept. of MAE) Dr. Alireza Ziarani (Dept. of ECE)
Outline • Background • Objectives • EMD and Hilbert Transform (HHT) • Detect Damage Time Instants using HHT • Detect Damage Location using Marginal HHT • Detect Damage Location using HHT of the Vibrational Deflection Shape • Future Work
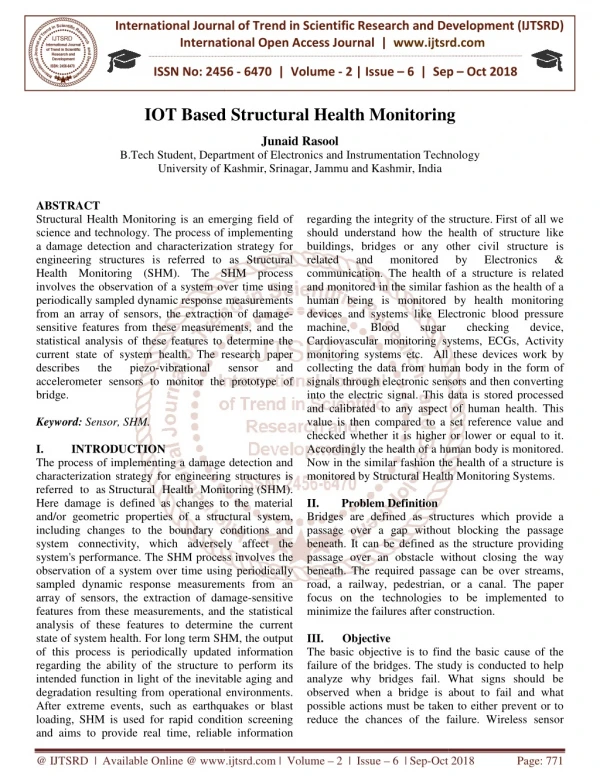
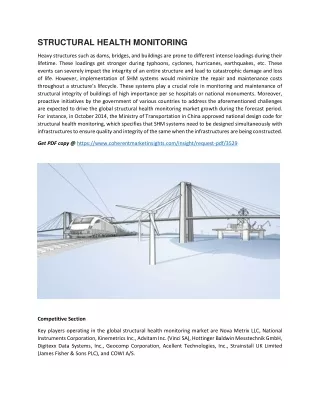
Background • SHM is crucial for safety and maintenance of aerospace, civil, and mechanical systems. • Damage state: Existence, Location, Type, Severity, Prognosis. • Current methods based on visual or localized experimental techniques (acoustic or ultrasonic, magnetic field, radiography, and eddy-current). • All of these localized techniques require that the vicinity of the damage is known a priori and that the portion of the structure is readily accessible. • A quantitative global damage detection method that can be used to locate damage is required urgently.
Vibration-Based SHM • Structural properties (natural frequency, mode shape, modal damping) are functions of physical parameters (geometry, connectivity, boundary condition, mass, stiffness, damping). • Recent technological advancements have helped vibration-based SHM (computation power, sensors, FE, system identification). • Limited practice of vibration-based SHM by engineering community so far. • Difficult to identify damage by examining response-time histories directly, compounded by excitation sources and/or environmental conditions.
Objectives • Identify the damage time instant and location by applying the HHT to the structure’s vibrational time history. • Detect and locate damage using both the HHT and Short Time Fourier Transform, and then compare the results. • Detect and locate damage by applying HHT to the structure’s vibrational deflection shape data instead of the time history data.
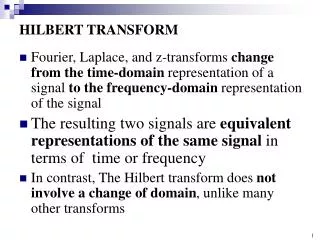
The Hilbert-Huang Transform (HHT) • HHT suitable for analyzing nonlinear and non-stationary data (Huang et al, 1998) • Empirical Mode Decomposition (EMD): Decomposes data into a finite, and often small, number of ‘intrinsic mode functions’ (IMF) which represent the nature of the vibration. • Hilbert Transform: Provides instantaneous frequencies and magnitudes as functions of time that give sharp identifications of imbedded structures. • Giving instantaneous frequency and magnitude rather than the global frequency and magnitude defined by traditional Fourier transform, the HHT makes physical sense at every point.
Hilbert Transform Let Analytic Signal: Where: and
The EMD Method (Sifting) IMF Sifting Result: Two Conditions for Intrinsic Mode Function (IMF): • The number of extremes and that of zero crossings must either equal or differ at most by one. • At any point, the mean value of the envelopes is zero. Example of a Typical IMF
Hilbert Spectrum • By performing the Hilbert Transform to the IMFs, we have the Hilbert spectrum • The residue can be treated as an IMF or simply left out. Magnitude-Frequency-Time Distribution of 1940 El Centro Earthquake
Detection of Damage Time Instants Using HHT • Excite with sinusoidal acceleration to steady state. • Simulate damage with sudden stiffness drop in one spring. • Record time history of each level’s response. • Apply HHT to time history data. • Damage time instant and location can be detected by analyzing the HHT of the time history. g Three story mass-spring system
Detection of Damage Time Instants Using HHT Mass: Stiffness: Damping: Governing Equations: Model Parameters and Facts: Where Natural Frequencies:
The First Natural Frequency Time History HHT Result
Frequency Dispersal Ratio Comparison 2.5 Dmg2(1.55,2.03) 2.0 Dmg2(1.62,1.89) Dmg3(2.35,1.65) 1.5 Dmg1(2.05,1.29) Dmg3(2.39,1.43) 2nd Level to 3rd Level Ratio Dmg1(2.07,1.22) 1.0 0.5 10% Damage 5% Damage 0.0 1.5 1.7 1.9 2.1 2.3 2.5 1st Level to 2nd Level Ratio Comparison of First Natural Frequency Results
Frequency Dispersal Ratio Comparison 0.35 Dmg1(0.227, 0.331) Dmg1(0.235, 0.321) 0.30 Dmg2(0.199, 0.302) Dmg2(0.480, 0.293) 0.25 0.20 2nd Level to 3rd Level Ratio Dmg3(0.189 , 0.15 0.154) Dmg3(0.164,0.096) 0.10 10% Damage 0.05 5% Damage 0.00 0.1 0.2 0.3 0.4 0.5 1st Level to 2nd Level Ratio Comparison of 25 Hz Results
Summary • The simulations show that the method is very sensitive to sudden change in structural stiffness. • The ratios between the frequency dispersal of each level’s response can be used as the indicator of damage location • The EMD and Hilbert transform based SHM method is suitable for identification of damage instants under constant harmonic excitation. • The closer the excitation frequency to the natural frequency of the structure, the larger is the size of the frequency dispersal, thus it is easier to identify the occurrence and location of the damage.
Detection of Damage Location using HHT FEM Simulation Setup • The first three natural frequency of the structure are 7.2Hz, 45.2Hz and 127.9Hz • A 200 Hz sine wave excitation is applied at the left end
Response of Undamaged StructureSensor 1 (a) HHT magnitude-frequency-time result (b) STFT frequency-magnitude-time result
Response of Undamaged StructureSensor 2 (a) HHT magnitude-frequency-time result (b) STFT frequency-magnitude-time result
Fourier Spectrum Damage Pattern 1, Sensor 2 Damage Pattern 1, Sensor 1 Damage Pattern 2, Sensor 1 Damage Pattern 2, Sensor 2
Hilbert-Huang Spectrum Damage Pattern 1, Sensor 1 Damage Pattern 1, Sensor 2 Damage Pattern 2, Sensor 1 Damage Pattern 2, Sensor 2
Summary • This method uses the changes in both magnitude and frequency, when compared with undamaged data, or finite element model data, can identify the occurrence and location of damage. • The HHT spectrum is more sensitive to the dynamic energy-frequency distribution and it is capable of capturing the difference in the structural response caused by damage. • The Fourier analysis is good at indicating the natural frequency changes, but it fails to capture the magnitude changes.
Detection of Damage Location Using HHT of Vibration Deflection Shape Bending Theory of a Cracked Beam Relationship between bending moment and deflection: Key idea: Abnormal concentration of curvature distribution near the crack.
Detection Procedure 1. Record the vibration deflection shape (VDS) of the structure, vibrating at steady state. 2. Estimate the curvature distribution from the vibrational deflection shape. 3. Apply EMD to curvature. Keep only the IMF which represents the dominant vibration mode. Get rid of useless or redundant information. 4. Apply Hilbert transform to the IMF. Transfer curvature concentration into frequency domain. 5. Examine the Hilbert spectrum. An abnormal frequency discontinuity can be found at the damage location.
Fixed-Free Beam, First N.F., Undamaged Original Result Mirror Image Result
First Natural Frequency Damage 1 Element 25 Damage 2 Element 1 Damage 3 Element 44
Third Natural Frequency, Undamaged Original Result EMD Process Of Mirror Imaged Data Mirror Imaged Result
Third Natural Frequency Damage 1, Element 44 Damage 2, Element 1
Fix-Fix Beam, undamaged Second Natural Frequency Fourth Natural Frequency
Second Natural Frequency Damage 1 Element 25 Damage 2 Element 1 Damage 3 Element 13
Fourth Natural Frequency Damage 1 Element 25 Damage 2 Element 1 Damage 3 Element 13
Conclusion • This method is effective, and has high sensitivity to damage. • Sensitivity to damage is highest in the middle and attenuates towards tips. • Higher frequency brings better sensitivity, but requires higher sensitivity and accuracy of equipments. • HHT is good for dynamic response. It has many good properties that can be used in various SHM methods.
Future Work • Experiments on real structures to examine the performance of these methods. • Study the effects of structural parameters and environmental factors to these methods. • Refine the algorithm of the EMD method to increase speed of calculation.
THE END THANK YOU