Download
1 / 26
260 likes | 503 Views
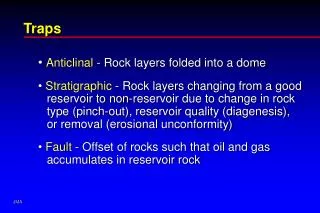
Statistical Tricks and Traps. Adapted from Ennis C. Almer’s book Statistical Tricks and Traps: An Illustrated Guide to the Misuses of Statistics. B. B. A. A. Correct: Twice as tall only creates a figure with twice the area. Misleading: Twice as tall and twice as wide.

E N D
Statistical Tricks and Traps Adapted from Ennis C. Almer’s book Statistical Tricks and Traps: An Illustrated Guide to the Misuses of Statistics
B B A A Correct: Twice as tall only creates a figure with twice the area Misleading: Twice as tall and twice as wide Increasing both height and width causes a geometric increase in overall area.
95% 94 % 93% 0 % Brand A Brand A Brand B Brand B Brand C Brand C Misleading: Small percentage differences illustrated with large differences among the bars Correct: Small percentage differences illustrated with small differences among the bars. Base starts at zero percent. Most Pickups Still on the Road
100% 90% 80% 70% 60% 50% 40% 30% 20% 10% 58% in 1980 47% in 1970 1970 1980 1990 2000 2010 2020 100% of Women in the Workforce? Misleading: Straight line projection to 100%. Note: Women aged 20 to 64 years in the workforce.
California 788 Arizona 98.5 Potentially misleading: Gallons of bottled water consumed (in millions) California 26.3 Arizona 26.6 Correct: Gallons of bottled water consumed per capita. Who wants bottled water?
What is the average household income? • Think about these mean scores: • 5 scores: 5, 4, 3, 1, 7 • 5 + 4 + 3 + 1 + 7 = 20 ÷ 5 = 40 • But, if one score changes: • 5 scores: 5, 4, 3, 1, 95 • 5 + 4 + 3 + 1 + 95 = 108 ÷ 5 =21.6 • 21.6 is not representative, since all students except one had scores of 1 through 5.
What is the average household income? • The median is the middle score. • 1, 3, 4, 5, 95 • The median is unaffected by the high score. • The average household income depends on which average you use. • Mean household income: $48,165 • Median household income: $35,536 • Ask for both mean and median. If they have similar values, use either; if not, use the median. Median
In God they trust? • # of references to God in declaration speeches of 9 candidates: • 1+1+1+1+2+2+2+3+14 (mode is 1) • 1+1+1+1+2+2+2+3+14=27 ÷ 9 = 3 (mean is 3) • 1+1+1+1+2+2+2+3+14 (median is 2) • If someone you do not trust is reporting averages to you, ask for the median, since it will provide a typical value even if distribution of scores is skewed by extreme values.
How many Internet users? • Group A, in a national poll on Internet usage, reported 24 million users. Group B reported 9.5 million users. • Group A defined a user as any person who had used the Internet within the previous 3 months. Group B defined a user as any person currently using the Internet and who could name an Internet application besides e-mail. • When reading polls, knowing how key variables were defined is crucial. Put more faith in poll results when you are given the actual questions asked and the definitions that were used.
How many business start-ups? • You rent store-front space, get appropriate permits, purchase a quantity of merchandise at wholesale prices, and hold a grand opening, yielding $50,000 in your first year. • US DOL does not consider you to have a business, as you have no employees. Thus, your activities would not be classified as a new start-up for the year. • Definitions and the purpose for which you are using the results are of utmost importance.
Who can you trust? • Dr. K had a GRA administer some tests in a pilot study that would extend her work into a new area. The results would have been published, except that she had the test results replicated by other GRAs, and the original results did not agree with their results. • Dear Dr. K: 25 years ago, I altered the results while measuring response times to try and make the study support the hypothesis. I was concerned at the time with the approval of others, and I felt that if the results supported your hypothesis, I would be more acceptable to you. I apologize for doing this and for jeopardizing your reputation.
Draw a happy face or not? • Tips from check with happy face • 31%, 27%, 26%, 23%, 23%, 21%, 21%, 19%, 18%, 18%, 17%, 17%, 17%, 16%, 15%, 15%, 15%, 15%, 14%, 14%, 13%, 12%, 9%, 9% • Mean tip was 18%. • Tips from check with no happy face • 48%, 40%, 38%, 33%, 31%, 27%, 23%, 23%, 23%, 22%, 21%, 21%, 21%, 20%, 18%, 16%, 15%, 9%, 0%, 0%, 0% • Mean tip was 21%.
Draw a happy face or not? cont’d • We have to look at the variation under each of the conditions. Even though has a lower mean (18%), every % is higher than the 3 lowest % tips for no . See means and standard deviations
Draw a happy face or not? cont’d • There was more variation in the No (sd=12) than in the condition (sd=5). Notice the range in No was 0% to 48%, while in , tips range from 9% to 31% (less variation). • Sd gives a rough guide to where the vast majority of values lie. For , sd of 5 means the majority of %s are within 5 pts of 18% (between 13% and 23%), while for No , the majority lies within 12 pts of 21% (between 9% and 33%).
What’s a cool face? • Kindergarteners were given an attitude test. They were asked to mark the appropriate face reflecting how they felt about school and then about homework. • = Happy face • = So-so face • = Sad face • Kids called the middle face the cool face and did not understand what so-so meant. • •
Unhealthy water? • Problem: An unusually high # of patients with skin rashes • Researchers needed to determine what they had in common, such as activities or things they ate; they also needed to determine what these patients had in common that were NOT in common with those who did not have the rash.
Unhealthy water?cont’d • After numerous interviews, researchers found that patients had all been swimming in a local lake. Signs were posted, and people were told to avoid the water. • Still, people were getting rashes, but they had not been swimming in the lake. • Physical examination at lake showed organism in soil was causing irritation. • It is not necessary to avoid this type of research, but you must carefully conduct and interpret it.
Liquor outlets cause crime? • Poorer neighborhoods have more crime and more liquor stores/bars than more prosperous neighborhoods. An obvious conclusion is that liquor outlets cause crime. • The report said, “Each liquor outlet contributed an average of 3.4 violent crimes a year. …” The word contributed suggests causality. Yet, the presence of more liquor outlets in poorer neighborhoods might be the result of the higher alcohol consumption in poor areas and not the cause.
Liquor outlets cause crime? • Observed relationship: We see more umbrellas when it rains than when it’s clear. • Causal conclusion: Umbrellas cause rain. • Observed relationship: A higher percentage of people are dead when they leave hospitals than the percentage that are dead when they leave other public buildings. • Causal conclusion: Hospital personnel kill people. • Observed relationship: People talk more about how hungry then are when they are in restaurants than when they are in other businesses. • Causal conclusion: Restaurants cause hunger.
Soybeans or animal fat? • Studies indicated that substituting soybean products for animal fat even for a short time cuts cholesterol levels by 9%. One expert stated that increasing soy consumption equals decreased chances of heart disease. • This is a confounding statement. Confounding refers to statistical studies in which there are 2 or more explanations for a given outcome.
Soybeans or animal fat?cont’d • In the studies reviewed, there was one outcome: reduced cholesterol. Yet there are 3 possible explanations for the outcome: • Increased intake of soy caused it • Decreased intake of animal fat caused it • Increased intake of soy in conjunction with decreased intake of animal fat caused it • If 2 or more treatments are given at the same time to the same subjects in an experiment, there will be a confounding that makes it impossible to definitively identify the effects of each treatment separately.
Soybeans or animal fat?cont’d • If 2 or more treatments are given at the same time to the same subjects in an experiment, there will be a confounding that makes it impossible to definitively identify the effects of each treatment separately. This could have been avoided by using 4 groups: • Group1: normal diet + soy supplement • Group 2: normal diet + reduced animal fat • Group 3: soy supplements + reduced animal fat • Group 4: no change in diet (control group)
Does designated driving work? • The idea is for one person in a group to be designated as the driver who will abstain from drinking alcohol. A criticism is that the program encourages alcohol consumption among those not designated as driver and that increased alcohol use has many negative social, personal, and health consequences.
Does designated driving work? cont’d • At first glance, statistics support the contention that the program works. In 1998, alcohol was involved in 15,936 traffic fatalities (38.4% of the total), the lowest level since the gov’t began tracking in 1975. • As point of comparison, there were about 28,000 such fatalities in 1980 and 17,461 in 1993.
Does designated driving work? cont’d • Unfortunately, the conclusion that designated driver programs are responsible for the decline is confounded by other variables. During this period, 17 states enacted laws that restrict driving by teens at night, and most states have enacted lower blood alcohol levels for teens (with some states having no tolerance for teen drinking).
Does designated driving work? cont’d • Another confounding variable is increased use of seat belts. • Another is that alcohol consumption in general has been declining during the period in question. • Whatever effect these programs have are co-mingled with the effects of other factors that may also have a large impact on the outcome. • Try one treatment at a time, ideally with a control group (such as comparable cities) that do not receive the treatment (which is not possible when the program is promoted nationally).