Download
1 / 67
670 likes | 796 Views
In this insightful exploration, Lee Rainie discusses the transformative impact of the digital ecosystem on everyday life. With humor and clarity, Rainie highlights the ubiquity of media and gadgets, the significance of broadband connectivity, and the rise of ordinary citizens as creators and publishers. He underscores how technology fosters communication, collaboration, and information sharing, reshaping the ways we interact and learn. This presentation serves as a valuable resource for educators and anyone looking to understand the implications of digital culture.

E N D
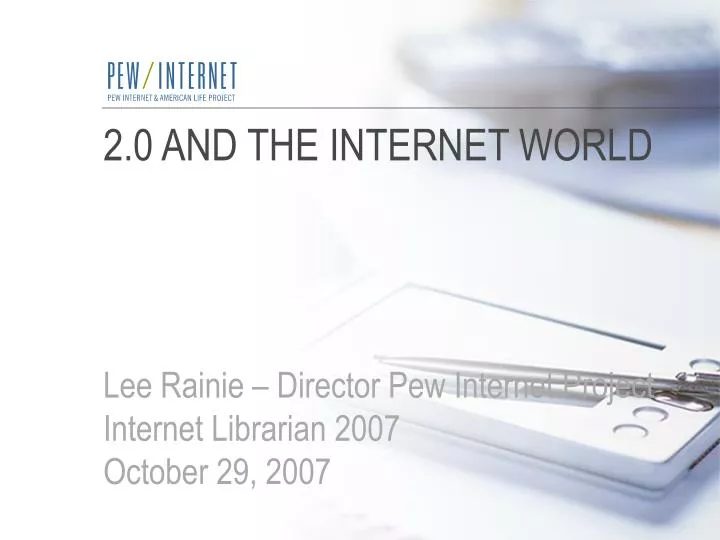
2.0 AND THE INTERNET WORLDLee Rainie – Director Pew Internet ProjectInternet Librarian 2007October 29, 2007
Who’s blogging this? Writings of a Loud Librarian – October 31, 2005 Indiana Librarian Marissa Priddis http://theloudlibrarian.net/2005/10/monterey-learning-stuff.html
“Rainie was funny, at ease, informative and we found ourselves do a lot of ‘Huh...I didn't know that’ during his speech. Very, very cool.”
“Good crisp presentation … backed with some actual research and drawing out the implications for educators, a list of which should be posted on the wall of every school ….”
“He’s a lot older than I imagined.” -------------------- “Looks like a typical Foundation suit.”
“While he may look older than some expected, and appears to be just another Foundation suit, he's a very intelligent man, and worth paying attention to.”
Beth Carpenter “Hey, Rainie, this is for you: "A fast-paced, informative session from a knowledgeable and entertaining speaker! I feel like this was just the tip of the iceberg, like there's so much more we could learn from Mr. Rainie if we only had more time…." :)”
Eight hallmarks of the new digital ecosystem
Hallmark 1 Media and gadgets are ubiquitous parts of everyday life
Home media ecology - 1975 Product Route to homeDisplayLocal storage TV stations phone TV Cassette/ 8-track broadcast TV radio broadcast radio stereo Vinyl album News mail Advertising newspaper delivery phone paper Radio Stations non-electronic Tom Wolzien, Sanford C. Bernstein & Co
Home media ecology – now Product Route to homeDisplayLocal storage cable TiVo (PVR) VCR TV stations DSL TV Info wireless/phone radio DVD “Daily me” broadcast TV PC Web-based storage content iPod /MP3 server/ TiVo (PVR) Cable Nets broadcast radio stereo PC Web sites satellite monitor web storage Local news mail headphones CD/CD-ROM Content from express delivery pager individuals iPod / storage portable gamer MP3 player / iPod Peer-to-peer subcarriers / WIFI cell phone pagers - PDAs Advertising newspaper delivery phone cable box Radio stations camcorder/camera PDA/Palm game console game console paper Satellite radio non-electronic storage sticks/disks Adapted from Tom Wolzien, Sanford C. Bernstein & Co
Hallmark 2 The internet, especially broadband connectivity, is at the center of the revolution
Internet and broadband adoption 1995-2007 All internet - 142 mill. Broadband at home- 96 mill.
Hallmark 3 New gadgets allow people to enjoy media, gather information, and carry on communication anywhere. Wirelessness is its own adventure.
88% of college students own cell phones 81% own digital cameras 63 own MP3 players 55% own video cameras 55% own laptops 27% of college students own a PDA or Blackberry ---- 77% of college students play games online Mobile devices – college student ownership
Hallmark 4 Ordinary citizens have a chance to be publishers, movie makers, artists, song creators, and story tellers
Content creation 55% of online teens have created their own profile on a social network site like MySpace or Facebook ---- 20% of online adults have such profiles
Content creation 33% of college students keep blogs and regularly post 54% read blogs ---- 12% of online adults have a blog 35% read them
Content creation 19% of online young adults have created an avatar that interacts with others online ---- 9% of all adult internet users have done this
Content creation 15% of young adult internet users have uploaded videos to the web ---- 8% of all adult internet users have done this
Hallmark 5 All those content creators have an audience. Even more internet users are accessing the material created by others
Accessing new information content 54% of college students have read blogs --- 36% of all adults do that
Accessing new information content 44% of young adult internet users seek information at Wikipedia sites --- 36% of all adults use them
Accessing new information content 14% of young internet users download podcasts --- 12% of all adults do
Hallmark 6 Many are sharing what they know and what they feel online and that is building conversations and communities
Information sharing and evaluation 37% of young adult internet users have rated a person, product, or service online --- 32% of all adults have done so
Information sharing and evaluation 34% of online young adults have tagged online content --- 28% of all adults have done that
Information sharing and evaluation 25% of younger internet users have commented on videos They also post comments on blogs and photos --- 13% of all adults have commented on videos
Hallmark 7 Online Americans are customizing their online experiences thanks to Web 2.0 tools
Information customization ~ 40% of younger internet users customize news and other information pages; ~ half are on specialty listservs
Information customization ~ A quarter to a third of younger internet users get RSS feeds
Hallmark 8 Different people use these technologies in different ways
Why a tech-user typology? Information & communications technology Applications
PIP’s tech-user typology • Assets • Internet (and broadband at home) • Computer use (laptop & desktop) • Cell phones • iPods • Web cams • Video recorders & digital cameras • Actions • User-generated content • Gaming • Cell phone applications • Attitudes • Help me be productive? • Give me more control? • Information overload?
Data Profile Age: late 20s Gender: Male dominant Race: Diverse Home b-band: 89% Special traits Students Wireless Photo and video freaks High end – Group 1OMNIVORES(8% of the population) They have the most information gadgets and services, which they use voraciously to participate in cyberspace and express themselves online and do a range of Web 2.0 activities such as blogging or managing their own Web pages.
High end – Group 2CONNECTORS(7% of the population) Data Profile • Age: late 30s • Gender: Female dominant • Race: Diverse (blacks) • SES: Upscale • Home b-band: 86% • Special traits • Email fanatics + IM • Cell phones • Media experiences by other means • Suspect their gadgets can do more; sometimes need help Between featured-packed cell phones and frequent online use, they connect to people and manage digital content using ICTs – all with high levels of satisfaction about how ICTs let them work with community groups and pursue hobbies.
Iconic CONNECTOR??? Diane Keaton – “Something’s Gotta Give”
High end – Group 3LACKLUSTER VETERANS(8% of the population) Data Profile • Age: 40ish • Gender: Male dominant • Race: Diverse, trending white • SES: Upscale • Home b-band: 77% • Special traits • Tech is necessary, not exiting • Dislike “always on” world • Parents (child at home) • Trad. channels of chatter and info predominate They are frequent users of the internet and less avid about cell phones. They are not thrilled with ICT-enabled connectivity.
High end – Group 4PRODUCTIVITY ENHANCERS(8% of population) Data Profile • Age: 40ish • Gender: Parity • Race: Diverse (Latino) • SES: Upscale • Home b-band: 71% • Special traits • Flip side of lackluster vets • Love tech for work use • Don’t have time or inclination to create or browse for fun They have strongly positive views about how technology lets them keep up with others, do their jobs, and learn new things.
Middle end – Group 1MOBILE CENTRICS(10% of the population) Data Profile • Age: early 30s • Gender: Parity • Race: Minorities rule • SES: Middle income • Home b-band: 37% • Special traits • Phone texters and photo takers • Not early adopters • More likely to be single • Not as many gadgets They fully embrace the functionality of their cell phones. They use the internet, but not often, and like how ICTs connect them to others.
Iconic MOBILE CENTRIC??? Alicia Silverstone – “Clueless”
Middle end – Group 2CONNECTED BUT HASSLED(10% of population) Data Profile • Age: mid-40s • Gender: Female dominant • Race: White • SES: Middle income • Home b-band: 80% • Special traits • Go online less frequently • Tech is not fun – it’s stressful • Experience info overload They have invested in a lot of technology, but they find the connectivity intrusive and information something of a burden.
Low end – Group 1INEXPERIENCED EXPERIMENTERS(8% of population) Data Profile • Age: 50ish • Gender: Female dominant • Race: Diverse • SES: Middle income • Home b-band: 15% • Special traits • Less online experience • Fewer tech assets • Fascinated with tech, and willing to try gadgets with coaching They occasionally take advantage of interactivity, but if they had more experience, they might do more with ICTs.