Download
1 / 36
360 likes | 378 Views
Analyze graphed functions, identify valid representation of slopes at every point, and explain why other choices are incorrect.

E N D
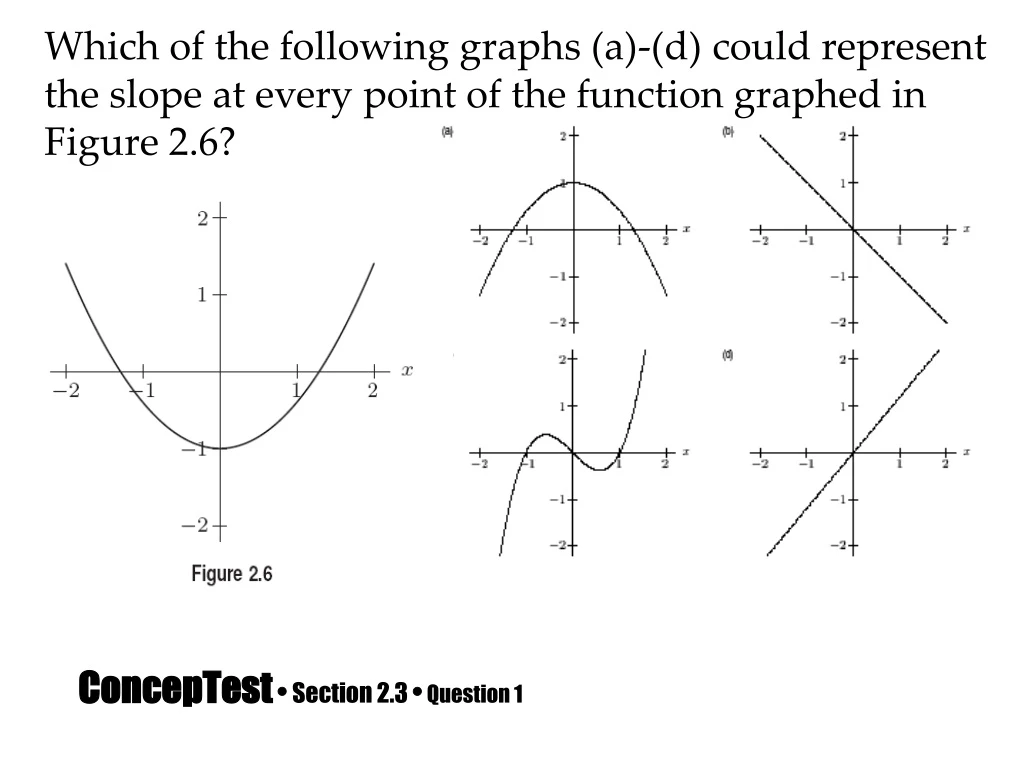
Which of the following graphs (a)-(d) could represent the slope at every point of the function graphed in Figure 2.6? ConcepTest• Section 2.3 •Question 1
ANSWER ConcepTest• Section 2.3 •Answer 1 (d) COMMENT: Your students should be analyzing where the extreme values of the original function occur and then whether the function is increasing or not. Have the students give specific reasons as to why the other three graphs could not represent the slope at every point of the function graphed in Figure 2.6.
Which of the following graphs (a)-(d) could represent the slope at every point of the function graphed in Figure 2.7? ConcepTest• Section 2.3 •Question 2
ANSWER ConcepTest• Section 2.3 •Answer 2 (b). The function has negative slopes for x < 0, positive slopes for x > 0, and a zero slope for x = 0. COMMENT: You could have students explain why (a), (c), and (d) fail to be the correct answer.
Which of the following graphs (a)-(d) could represent the slope at every point of the function graphed in Figure 2.8? ConcepTest• Section 2.3 •Question 3
ANSWER ConcepTest• Section 2.3 •Answer 3 (c). The function in Figure 2.8 has horizontal tangents at about x = 0.7, is increasing for x < –0.7 and x > 0.7. Thus the graph of the slope of the function will be positive for |x| > 0.7, negative for |x| < 0.7, and zero for x = 0.7. COMMENT: You could have students explain why (a), (b), and (d) fail to be the correct answer.
Which of the following graphs (a)-(d) could represent the slope at every point of the function graphed in Figure 2.9? ConcepTest• Section 2.3 •Question 4
ANSWER ConcepTest• Section 2.3 •Answer 4 (d). The original function has horizontal tangents at 0, π, 2π, so the derivative will be zero there. This eliminates choices (a) and (b). The original function is also decreasing for 0 < x < π, so its derivative must be negative in this region. COMMENT: You could have students explain why (a), (b), and (c) fail to be the correct answer.
Which of the following graphs (a)-(d) could represent the slope at every point of the function graphed in Figure 2.10? ConcepTest• Section 2.3 •Question 5
ANSWER ConcepTest• Section 2.3 •Answer 5 (d). The original function has horizontal tangents at x = π/2 and 3π/2, so the slope of the function is zero at those points. This eliminates (a) and (c). It is also increasing for 0 < x < π/2, so its slope of the function is positive in this region. COMMENT: You could have students explain why (a), (b), and (c) fail to be the correct answer.
Which of the following graphs (a)-(d) could represent the slope at every point of the function graphed in Figure 2.11? ConcepTest• Section 2.3 •Question 6
ANSWER ConcepTest• Section 2.3 •Answer 6 (b) COMMENT: Your students should analyze where the extreme values of the original function occur and where the function is increasing. Have the students give specific reasons as to why the other three graphs could not represent the slope at every point of the function graphed in Figure 2.11.
Suppose f’(x) < 0, for 0 < x < 2, for 4 < x < 5, and for 6 < x. f’(x) > 0, for x < 0, for 2 < x < 4, and for 5 < x < 6. Which of the graphs (a)-(d) could be the graph of f(x)? ConcepTest• Section 2.3 •Question 7
ANSWER ConcepTest• Section 2.3 •Answer 7 (c) and (d) COMMENT: Your students should try to draw other graphs that meet the same requirements. Have students give reasons as to why the other two choices are invalid.
Which of the following graphs (a)-(d) could represent the slope at every point of the function graphed in Figure 2.12? ConcepTest• Section 2.3 •Question 8
ANSWER ConcepTest• Section 2.3 •Answer 8 (a). Because Figure 2.12 shows a constant value of 1, the original function will be a line with slope 1. COMMENT: This question (and the ones following) are meant to help students realize that they can think about the slope of a function from two viewpoints, either first using the function to find the slope at each point, or being given the slope at every point and then trying to recover the function. This should help them when they begin studying antiderivatives.
Which of the following graphs (a)-(d) could represent the slope at every point of the function graphed in Figure 2.13? ConcepTest• Section 2.3 •Question 9
ANSWER ConcepTest• Section 2.3 •Answer 9 (d). The graph of the slope is positive, and increasing from 0 to 5 as x goes from 0 to 5, therefore the function must be increasing and concave up. COMMENT: See Comment for Problem 8.
Which of the following graphs (a)-(d) could represent the slope at every point of the function graphed in Figure 2.14? ConcepTest• Section 2.3 •Question 10
ANSWER ConcepTest• Section 2.3 •Answer 10 (d). Since the graph of the slope is decreasing at every point, the function will be concave down. The graph of the function needs an initial slope of 3 and a horizontal tangent at x = 3. COMMENT: See Comment for Problem 8.
Which of the following graphs (a)-(d) could represent the slope at every point of the function graphed in Figure 2.15? ConcepTest• Section 2.3 •Question 11
ANSWER ConcepTest• Section 2.3 •Answer 11 (c). The graph of the slope is positive at every point, so the function must be increasing. COMMENT: See Comment for Problem 8.
Which of the following graphs (a)-(d) could represent the slope at every point of the function graphed in Figure 2.16? ConcepTest• Section 2.3 •Question 12
ANSWER ConcepTest• Section 2.3 •Answer 12 (a) and (d). The graph of the slope at every point increases from a negative value at x = –3, to a slope of zero at x = 0, to a positive value for x > 0. COMMENT: See Comment for Problem 8.
Which of the following is a graph of a function that is equal to its own derivative, that is, f’(x) = f(x). ConcepTest• Section 2.3 •Question 13
ANSWER ConcepTest• Section 2.3 •Answer 13 (c). The slope of the curve in (a) is always positive while the function has both positive and negative values, so f’(x) ≠ f(x). The slope of the curve in (b) is always negative, while the function has only positive values, so f’(x) ≠ f(x). In (c), both the function and its slope are positive, and the slope at (0, 1) appears to be 1. The function and slope increase together, so f’(x) = f(x). The graph in (d) has only positive values while its slope has both positive and negative values, so f’(x) ≠ f(x). COMMENT: You could have students suggest formulas for the graphs in each choice.
Which of the following is a graph of a function that is equal to the negative of its own derivative, that is, f(x) = – f’(x). ConcepTest• Section 2.3 •Question 14
ANSWER ConcepTest• Section 2.3 •Answer 14 (c). With f(x) = – f’(x), the function will have positive slopes where it is negative and negative slopes where it is positive. This rules out (b) and (d). With f(x) = – f’(x), as the function gets larger the slope will be steeper. This rules out (a). The slope in (c) at (0, 1) appears to be –1. COMMENT: You could have students suggest formulas for the graphs in each choice.
Which of the following graphs (a)-(d) could represent the slope at every point of the function graphed in Figure 2.17? ConcepTest• Section 2.3 •Question 15
ANSWER ConcepTest• Section 2.3 •Answer 15 (c). The graph of the function in Figure 2.17 has horizontal tangents at x ≈ 0, –1.6, 1.6, is increasing for x < –1.6 and x > 1.6, and is decreasing for –1.6 < x < 1.6. Thus, the derivative will be positive for x < –1.6 and x > 1.6, negative for 0 < |x| < 1.6, and zero for x ≈ 0, –1.6, 1.6. COMMENT: You could have students explain why (a), (b), and (d) fail to be the correct answer.
ConcepTest• Section 2.3 •Question 16 If f’(x) = g’(x), then f(x) = g(x). (a) True (b) False
ANSWER ConcepTest• Section 2.3 •Answer 16 (b). If f’(x) = g’(x), then f(x) = g(x) + C, where C is some constant. COMMENT: You might point out that the graphs of f and g differ by a vertical shift. A student’s instinct is to answer True. Have students suggest their own counterexamples.
If y = π5, then y’ = 5π4. (a) True (b) False ConcepTest• Section 2.3 •Question 17
ANSWER ConcepTest• Section 2.3 •Answer 17 (b). Since π5 is a constant, then y’ = 0. COMMENT: This question seems remarkably obvious in class. However, on an exam students tend to miss this question.
ConcepTest• Section 2.3 •Question 18 (a) True (b) False
ANSWER ConcepTest• Section 2.3 •Answer 18 (a). y is a polynomial of degree four. COMMENT: Make sure your students realize that they don’t need to take a derivative to answer this question.