Download
1 / 23
230 likes | 448 Views
The Pharmacist’s Role in Quality: A PQA Demonstration Project. Mark Conklin, PharmD, MS September 16, 2009. The Pharmacy Quality Alliance. Established in April 2006, as a public-private partnership. Drs. Mark McClellan & Carolyn Clancy - Inaugural PQA Steering Committee members.

E N D
The Pharmacist’s Role in Quality:A PQA Demonstration Project Mark Conklin, PharmD, MS September 16, 2009
The Pharmacy Quality Alliance • Established in April 2006, as a public-private partnership. • Drs. Mark McClellan & Carolyn Clancy - Inaugural PQA Steering Committee members. • Consensus-based, membership alliance with over 50 members. • PQA is a nonprofit 501(c)(3) organization. • Mission: Improve the quality of medication use across health care settings through a collaborative process in which key stakeholders agree on a strategy for measuring and reporting performance information related to medications.
PQA Board of Directors • Steven Anderson, NACDS • Judy Cahill, AMCP • Laura Cranston, PQA, Inc. • Woody Eisenberg, Medco • John Feather, ASCP • William Fleming, Humana, Inc. • Karen Ignagni, AHIP • Jeffrey Kelman, CMS • David Marshall, Teva USA • Mark McClellan, Brookings • Thomas Menighan, APhA • Eleanor Perfetto, Pfizer • Bruce Roberts, NCPA • Lee Rucker, AARP • Bruce Sherman, Goodyear Tire Co. • Becky Snead, NASPA
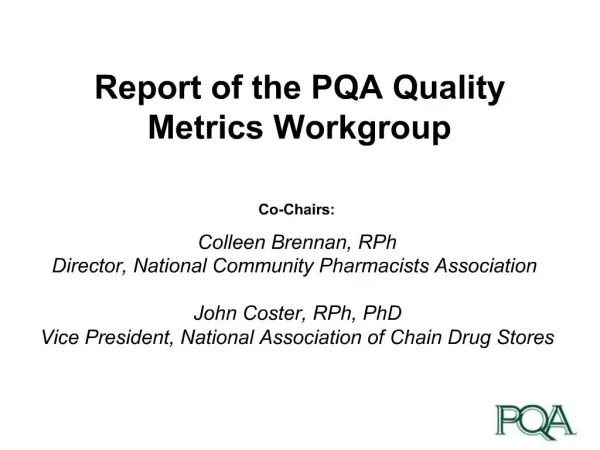
Who’s at the PQA Table? • Pharmacy Trade Groups • Managed Care Organizations • Health Plans • AARP • Consumer Advocacy Groups • Pharmacy Practitioner Groups • PBMs • Employer Coalitions • Pharm. Manufacturers • Health IT Vendors • MTM Vendors • Chain Drug Companies • Independent Pharm. Owners • Outcomes Researchers
PQA Board of Directors Administrator Executive Director Director Grants & Sponsored Programs Director Membership & Outreach Director Research & Practice Improvement Oversight of Demo Projects Measure Uptake and Implementation Strategies Group Education & Communication Workgroup Research Coordinating Council Quality Metrics Workgroup RFP Development Commercial Insurers & Managed Care Plans Cluster Groups Funding Sources PBM Prevention & Wellness Business Coalitions, Employers, Benefit Consultants Medication Reconciliation Research Priorities Quality Measurement Expert Panel Pharmacist Role In Medical Home Public Payers Federal Level MTM Services Cost of Care Public Payers State Level (Medicaid) Patient Safety PQA Organizational Workgroup Structure 2009
Demonstration Project Objectives • Determine resources requirements for collecting/aggregating prescription claims data and calculating the 15 PQA quality measure scores • Collection of patient experiences with pharmacy services using the PQA-sponsored survey • Generate/test models of providing pharmacy performance reports • Get feedback from pharmacists on the reports’ accuracy, user-friendliness and value in improving quality
Project Team & Roles • Highmark Blue Cross Blue Shield • Data source, Project coordination & strategy • CECity (Annette Boyer) • Technology vendor • Rite Aid (Rick Mohall) • Pharmacy provider (n = 50) • Avatar International (David Medvedeff) • Administrator, consumer experience survey
Pharmacist Training • 2 hour live training sessions • 90+ pharmacists • Topics: • Introduction to performance measurement & reporting • Specific education on the quality metrics to be used • Reporting process • Future & importance of focus on clinical activities and quality improvement
Initial Pharmacist Perceptions • Excitement • Means to expand the clinical role of the RPh • Input into the performance measurement process • Strong sense of self-efficacy to provide quality care • Concern • What about claims not captured by the health plan? • Will the time and resources be available to allow the RPh to move the metrics in a positive manner? • Physician acceptance of interventions • Proper team approach to care of mutual patients
Rx Claims Data for the 15 PQA measures & survey Performance Reports Quantitative & Qualitative Feedback Demonstration Project Process Flow Health Plan Data Warehouse CECity’s Lifetime™ Platform Rite Aid Pharmacists Collaborative Feedback & Analysis
Measures grouped by category Comparison against peers Measure value and number of patients • Arrow indicates direction of change from previous period. • Color indicates if the change occurred in the recommended direction. Image: PQA Demonstration Project
Image: PQA Demonstration Project Additional information on peers Detailed analysis over time Measure Definition
Pharmacist Feedback • Electronic feedback survey • Completed after viewing each round of the performance reports • Pharmacist focus group • Conducted 1 week after the final round of reports was closed
Pharmacist feedback – 1st round 5-point Likert-type scale (1 = Strongly agree to 5 = Strongly Disagree)
Pharmacist feedback – 2nd round 6-point Likert-type scale (1 = Strongly Agree to 6 = Strongly Disagree)
Pharmacist feedback – Barriers • Operational barriers (i.e. lack of time, resources) • Health plan/insurance barriers • Physician barriers • Physician office staff barriers • Organizational barriers (i.e. lack of corporate support)
Best Practice Concepts • Content • Use of nationally recognized, standardized performance metrics • Interventions for improvement should be linked to practice needs • Process • Multi-disciplinary stakeholders • Integration into workflow • Meaningful reporting that is actionable, scalable • Technology • Secure, web-based platform that supports customizable dashboards to present quality data/measures to the participating pharmacies • User friendly, easy to navigate platform • Scalable with ability to coordinate data from multiple sources
Next steps: “Phase 2” • Can pharmacists/pharmacies engage in meaningful performance improvement strategies? • What data is necessary to inform a new model for pharmacy reimbursement? • Sustainable business model for quality care? • What mechanism(s) can be employed to provide pharmacy quality information to consumers? • Targeted QI strategies
Patient Activation You are now here – So now do this You are here – So do this Problem Res Verbal Comm Empathy Patient Safety Next steps: Targeted QI Example