Download
1 / 17
170 likes | 366 Views
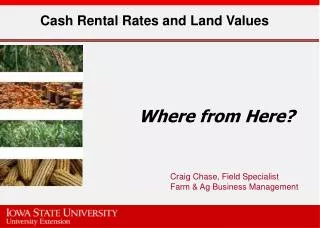
Farmland Values & Cash Rent. Craig Dobbins. 2011 Purdue Land Value Survey Cash Rent Results . Average Quality Cash Rent, 1975 - 2011. Cash Rent Comparison 2002 - 2006 & 2007 - 2011. Cash rent per bu. – Average soil . Preliminary 2011 Purdue Land Value Survey – Land Value Results.

E N D
Farmland Values & Cash Rent Craig Dobbins
Preliminary 2011 Purdue Land Value Survey – Land Value Results
Comparison of Change in Farmland Value2002 – 2006 & 2007 - 2011
New Price Plateau Source: Dr. Scott Irwin
Continue Higher • Strong demand for corn from the ethanol industry because of biofuel mandates • Strong soybean export demand • 2011 U.S. corn and soybean crop that is average or below average • Moderate increases in input costs for corn and soybeans, keeping crop production margins well above historic average • Low long-term interest rates • Little change in the amount of land available for sale
Steady or Decline • Sharp decline in corn and/or soybean export demand • Sudden change in the U.S. policy away from providing biofuel subsidies and mandating usage • Sharp rise in interest rates because of a downgrade in the credit rating of U.S. government debt obligations or increased inflation fears • Exceptionally large 2011 corn and soybean crop • Sharp rise in crop input prices reducing crop production margins • Further slowing of world growth because of sovereign debt problems, including the U.S. • Strong supply response resulting from new capital investments in agricultural production • U.S. recession • Some combination of the above or some unknown development