Download
1 / 27
280 likes | 462 Views
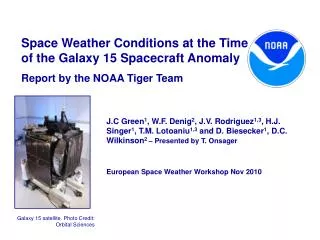
For Official Use Only. Space Weather Conditions at the Time of the Galaxy 15 Spacecraft Anomaly Report of the NOAA Tiger Team Boulder, CO 01 June 2010. Galaxy 15 satellite. Photo Credit: Orbital Sciences. Galaxy 15 NOAA Tiger Team.

E N D
For Official Use Only Space Weather Conditions at the Time of the Galaxy 15 Spacecraft Anomaly Report of the NOAA Tiger Team Boulder, CO 01 June 2010 Galaxy 15 satellite. Photo Credit: Orbital Sciences
Galaxy 15 NOAA Tiger Team At the request of the NWS/Space Weather Prediction Center (SWPC) Director the NOAA Tiger Team was formed to determine the likely space environmental conditions experienced by the Galaxy 15 spacecraft prior to and at the time of the reported anomaly. The Tiger Team was comprised of representatives from SWPC and the NESDIS National Geophysical Data Center (NGDC): Janet Green, SWPC (co-chair) William Denig, NGDC (co-chair) Howard Singer1, SWPC Daniel Wilkinson, NGDC Douglas Biesecker, SWPC William Murtagh1, SWPC Juan Rodriguez, SWPC (CIRES) Paul Lotoaniu, SWPC (CIRES) Group Picture CIRES – Cooperative Institute for Research in Environmental Sciences 1Not in photograph
OUTLINE Space Weather Conditions – 05 Apr 10 Space Weather describes changes in the interconnected system from the Sun to Earth • This presentation follows space weather conditions progressing from the sun to near the Galaxy 15 location showing: • Events that occurred at the sun • Resulting global changes in the near-earth space environment • Local changes near Galaxy 15 in the energetic charged particles that can cause satellite charging and electronic component failure • Summary • Solar activity was elevated but not remarkable • Global geomagnetic activity described by the AL auroral electrojet index and Kp were extreme. Other SWx indices were more moderate • Local measurements near Galaxy 15 show that a large geomagnetic substorm occurred 48 minutes prior to the anomaly. The substorm caused remarkable increases in the measured local flux of energetic particles known to cause surface or internal satellite charging
Background (1 of 2) Galaxy 15 Satellite Anomaly - Impacts 08 Apr 2010 – Intelsat reports that the Galaxy 15 stopped responding to ground commands (Anomaly time: 05 April @ 09:48 UTC) 10 Apr 2010 – FAA predicts erosion of WAAS capability due to Galaxy 15 failure 20 Apr 2010 – Orbital attributes the loss of Galaxy 15 to space weather 30 Apr 2010 – Intel reports Galaxy 15 still adrift and threatens nearby satellites (i.e. frequency interference)
Background (1 of 2) Operational Timeline • Operational Timeline – Universal Time (UT) • April 3, 2010 • 09:54 B7 solar flare (sunspot region 1059) • 10:33 CME first visible • 22:04 SWPC Daily Forecast issued • Notes Flare and Coronal Mass Ejection (CME) • Geomagnetic quiet expected: 04-05 April • April 4 • 22:01 Daily Forecast issued (left text) • Flank of CME may contribute to elevated activity on April 7 • April 5 • 05:33 Warning issued: K=4 • 05:44 Alert issued: K=4 • 08:04 Warning issued • Sudden Impulse (CME hits ACE @ 07:56 UT) • 09:16 Warning issued: K=5 • 09:17 Alert issued: K=5 • 09:22 Alert issued: K=6 • 09:48 Galaxy 15 anomaly • 09:56 Alert issued: K=7
Space Weather Conditions 1. Events at the Sun (1 of 3) Solar activity prior to the Galaxy 15 anomaly on April 05 at 9:48 was elevated but unremarkable. • On 03 April @ 9:54 UT (2 days prior to the anomaly) a solar B7 flare was observed by the NOAA GOES-14 X-Ray Sensor (XRS) • Flares of this intensity are not usually associated with intense space weather • In solar cycle 23 there were >14,000 flares more intense than a B7-level flare • There have already been 125 flares more intense than B7 in the new cycle • Source of the flare was decaying active region 1059 (S22W15) with 4 sunspots Satellite Eclipse B7 FLARE
SOHO/LASCO NASA/ESA STEREO COR2 NASA Space Weather Conditions 1. Events at the Sun (2 of 3) EARTH • April 03 @ 10:33 UT ~30 minutes after the flare an earthward directed coronal mass ejection (CME) was observed • SOHO/LASCO imager showed a modest partial Halo event • Side view of the CME from the NASA STEREO COR2 instrument indicated that it was moving southward and only the ‘edge’ would graze earth • Measured plane of sky speed was 512 km/s • Moderate speeds and ‘edge’ impacts such as these typically cause weaker, shorter duration geomagnetic storms • Solar cycle 23 had ~500 faster Earth directed CME’s • This event was classified as a moderate CME ejected from an otherwise quiet sun • F10.7 was 77 sfu, the sunspot count was 27 and the x-ray background was a modest 3.9x10⁻⁸ Watts m-2 • At solar maximum, F10.7 is expected to be about 150 sfu and the sunspot count to be at least 3x greater Note: F10.7 measured in terms of solar flux units (sfu) where 1 sfu = 10-22 Watts m-2 Hz-1 Sunspot counts as defined in accordance to Johann Rudolf Wolf (1816-1893) – see http://www.ngdc.noaa.gov/stp/solar/ssn.html See http://www.swpc.noaa.gov/info/glossary.htmlfor a discussion of x-ray background levels
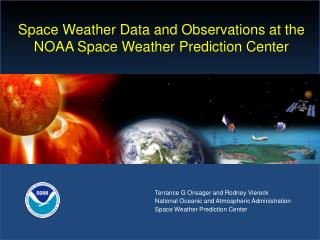
Space Weather Conditions 1. Events at the Sun (3 of 3) Galaxy 15 anomaly • April 05 07:56 UT – Nearly 2 days after the CME lifted off from the sun, it was observed by the NASA ACE satellite upstream of earth • It takes ~30 minutes for the solar wind to propagate from ACE to Earth • The solar wind magnetic field turned southward (negative) • The solar wind speed increased from ~500 to >700 km/s CME detected by ACE Such solar wind conditions often result in a moderate geomagnetic storm Note: ACE is the NASA Advance Composition Explorer located at the L1 sun-earth Lagrangian point approximately ~1.5x10⁶ km in the sunward direction. Plot shows solar wind parameters observed at ACE, time-shifted to Earth. Data Source: NASA Omni
Space Weather Conditions 2. Global Environment At Earth (1 of 2) Some (but not all) global geomagnetic activity indicators were extreme immediately prior to the anomaly 01 Oct 05 to 01 May 10 Currently only quick look plots are available for April AL index was <-2000 nT prior to the anomaly. Larger values observed only once previously during Galaxy 15 lifetime (launched: 13 Oct 05) Kp index reached 7.7 prior to the anomaly. Larger values were observed only once previously during the Galaxy 15 lifetime However, Dst index reached -32 nT prior to anomaly indicating only a moderate storm – similar to many previously observed levels during the Galaxy 15 lifetime ? Indices provided by the Kyoto World Data Center
Space Weather Conditions 2. Global Environment At Earth (2 of 2) April 5th “event” as an interval of general interest 1. POES Energetic Particles (animation) 3. Magnetospheric reconfiguration? Data Provider: USGS / Source: INTERMAGNET 4. Extreme magnetic deviations near local midnight (Galaxy 15 footprint) 2. DMSP Convective Drifts (off-scale) Data Provider: GSC / Source: INTERMAGNET
Satellite Locations Space Weather Conditions 3. Local Environment At Galaxy 15 (1 of 5) April 05 @ 09:00 UT: GOES magnetometers and particle instruments showed a major reconfiguration of the magnetosphere indicative of a substorm and injection of energetic particles into the nightside, near-earth space environment. Galaxy 15 (133 W) Anomaly 09:48 UT Eclipse
Space Weather Conditions Aside: Particle-Induced Spacecraft Anomalies • Energetic space particles are responsible for 3 known classes of satellite anomalies • Surface Charging ~0-100 keV electrons may contribute to satellite surface charging (NASA-HDBK-4002, 1999) • Internal Charging ~>100 keV electrons may penetrate through ~3 mils aluminum shielding and cause internal charging (NASA-HDBK-4002, 1999) • Single Event Upsets/Burnout/Latchup ~>5 MeV protons may penetrate through ~3 mils of aluminum shielding (NASA-HDBK-4002, 1999) and cause a temporary upset or permanent damage as it passes through an electronic component
Space Weather Conditions Aside: GOES Sensor Availability • GOES 13 became the operational GOES EAST satellite on April 14, 2010 – at the time of the Galaxy 15 anomaly, SWPC was not yet receiving its data • GOES 14 Space Environment Monitor was kept on following completion of Post-Launch Test (PLT) in late 2009 in order to support GOES 15 PLT • GOES 15 has been in PLT following satellite launch in March 2010 • None of the 30-800 keV electron measurements discussed herein important for this anomaly study were on an operational satellite at the time (fortunately GOES 14 & 15 PLT activities were ongoing) • Substantial work is still required to develop this capability for real-time situational awareness and forecasting
Galaxy 15 anomaly Satellite Locations Space Weather Conditions 3. Local Environment At Galaxy 15 (2 of 5) • Surface Charging: Electron Environment(Low-to-Medium Energy Electrons) • April 05 @ 9:00 – 48 minute prior to the Galaxy 15 anomaly the 40-to-475 keV electron flux increased at GOES 14 and 15 • 75-to-475 keV electron flux was the highest observed since GOES 14 was turned on in July 2009 and since GOES 15 was turned on in April 2010 • High electron fluxes are notable although surface charging potentials cannot be accurately estimated without lower energy (<40 keV) particle measurements and detailed modeling of their interactions with specific satellite surface materials • Note: Future GOES-R instruments will measure low energy electrons and protons within the energy range 30 eV to 30 keV GOES 14----- GOES 15----- At 0948 UT 12 LT G12 24 LT G15 G14 Note: Multiple curves for each GOES satellite correspond to different telescope “look” directions Galaxy G11 Satellite Locations 12 LT
Galaxy 15 anomaly Satellite Locations Space Weather Conditions 3. Local Environment At Galaxy 15 (3 of 5) • Internal Charging: Electron Environment(Medium-to-High Energy Electrons) • April 05 @ 9:00 – 48 minutes prior to the anomaly 275-475 keV electron flux increased at GOES 14 and 15 • Flux of 275-475 keV electrons was the highest observed since GOES 14 was turned on in July 2009 and GOES 15 since April 2010 (GOES 11 does not measure electrons below .8 MeV • Flux of >.8 MeV electrons measured by GOES 11, 14 and 15 did not increase above prior levels • Internal charging is still commonly inferred from the >.8 MeV alone because the lower energy data was not operationally available on satellites prior to GOES 13 GOES 14----- GOES 15----- GOES 11----- Flux increase (275 keV / 475 keV) Moderate increase (>.8 MeV / >2 MeV) At 0948 UT 12 LT No increase (>4 MeV) G12 24 LT G15 G14 Galaxy G11 Satellite Locations 12 LT
Galaxy 15 anomaly (note change of time scale) Satellite Locations Space Weather Conditions 3. Local Environment At Galaxy 15 (4 of 5) • Internal Charging: Electron Environment(Additional Considerations) • As a rule of thumb an accumulated charge of 1010 to 1011 q/cm2 can induce internal discharges within spacecraft (Note: “q” refers to an electronic charge) • On April 5th the accumulated charge calculated at GOES 14 using the measured >350 keV electron flux prior to the anomaly can be calculated for different dielectric discharge time constants • Dielectric time constants, t, for typical dielectric material range from 10 to 105 s (Garrett and Whittlesey, 2000) q/cm2 at time of Galaxy 15 anomaly t=105 s q/cm2 at time of Galaxy 15 anomaly t=104 s q/cm2 at time of Galaxy 15 anomaly t=103 s q/cm2 at time of Galaxy 15 anomaly t=102 s
Galaxy 15 anomaly Satellite Locations Space Weather Conditions 3. Local Environment At Galaxy 15 (5 of 5) • Single Event Upsets / Latchups / Burnouts: Proton Environment • April 05 @ 9:00 – GOES 11, 14 and 15 measured increased proton flux limited to the 2.5 MeV channel • Flux increase was notable although GOES 11 measured numerous events with higher flux rates over the lifetime of Galaxy 15 • Protons with energies >5 MeV required to penetrate typical spacecraft shielding (3 mils Al) • GOES 11, 14 & 15 measured no increase in the 6.5 MeV and 11.5 MeV channels GOES 14----- GOES 15----- GOES 11----- 2.5 MeV 6.5 MeV 11.5 MeV At 0948 UT 12 LT G12 24 LT G15 G14 Galaxy G11 Satellite Locations 12 LT
Space Weather Conditions Galaxy 15 Anomaly (05 Apr 2010 0948 UT) Statistical Distribution of Spacecraft Anomalies GALAXY 15 anomaly occurred in the midnight to dawn local time sector, where anomalies are most likely to be observed. GALAXY 15 anomaly occurred near equinox which is the time of year where anomalies are most likely to occur Around equinox is also the time of year where geosynchronous spacecraft encounter eclipse periods and elevated geomagnetic activity
Summary SWx Conditions for Galaxy 15 – 05 Apr 10 • Conclusions: • Energetic particle flux measurements (protons & electrons) in the GEO space environment near midnight and on the dawn flanks for 05 April 2010 are available for use in Galaxy 15 anomaly investigations • Measured electron fluxes at low to moderate energies are consistent with increased risk factors for surface and internal spacecraft charging • Measured high-energy proton fluxes are not consistent with increased risk of single-event upsets, latchups and burnouts by sensitive electronic components • W.F. Denig et al., Space Weather Conditions at the Time of the Galaxy 15 Spacecraft Anomaly (submitted for presentation) • J.C. Green et al., Satellite charging applications from the particle and field instruments on the NOAA satellites (submitted for presentation) • J.V. Rodriguez et al., GOES-R Moments and Spacecraft Charging Algorithm and Application to Anomaly Studies(submitted for presentation)
References SWx Impacts on Spacecraft Baker, D. N., T. I. Pulkkinen, X. Li, S. G. Kanekal, J. B. Blake, R. S. Selesnick, M. G. Henderson, G. D. Reeves, H. E. Spence and G. Rostoker (1998b), Coronal mass ejections, magnetic clouds, and relativistic magnetospheric electron events: ISTP, J. Geophys. Res., 103,17,279–17,292, doi:10.1029/97JA03329. Davis, V.A., M.J. Mandell and M.F. Thomsen, Representation of the measured geosynchronous plasma environment in spacecraft charging calculations, J. Geophys. Res., 113, A10204, doi:10.1029/2008JA013116, 2008. DeForest, S.E., Spacecraft Charging at Synchronous Orbit, J. Geophys. Res., 77, 651-659, 1972. Farthing, W.H., J.P. Brown and W.C. Bryant, Differential Spacecraft Charging on the Geostationary Operational Environmental Satellites, NASA-TM-83908, NASA Technical Memo, 43 pp., 1982. Garrett, H.B., Review of Quantitative Models of the O- to 100-keV Near-Earth Plasma, Rev. Geophys Space Phys., 17, 397-417, 1979. Garrett, H.B., The Charging of Spacecraft Surfaces, Rev. Geophys. Space Phys., 19, 577-616, 1981. Garrett, H.B. and A.G. Rubin, Spacecraft Charging at Geosynchronous Orbit - Generalized Solution for Eclipse Passage, Geophys. Res. Lett., 5, 865-868, 1978. Garrett, H.B. and A.C. Whittlesey, Spacecraft Charging, An Update, IEEE Trans. on Plasma Sci., 28, p 2017, 2000. Garrett, H.B., D.C. Schwank, P.R. Higbie and D.N. Baker, Comparison Between the 30- to 80-keV Electron Channels on ATS 6 and 1976-059AD uring Conjunctiona nd Application to Spacecraft Charging Prediction, J. Geophys. Res., 85, 1155-1162, 1980. Harris, J.T., Spacecraft Charging at Geosynchronous Altitudes: Current-Balance and Critical Temperature in a Non-Maxwellian Plasma (Thesis), Air Force Institute of Technology, 92 pp., 2003. Mulville, D.R., Avoiding problems caused by spacecraft on-orbit charging effects, NASA-HDBK-4002, NASA Technical Handbook, 45 pp., 1999. Purvis, C.K., H.B. Garrett, A.C. Whittlesey, H.J. Stevens, Design Guidelines for Assessing and Controlling Spacecraft Charging Effects, NASA-TP2361, NASA Technical Paper, 44 pp., 1984. Zong, Q.-G., X.-Z. Zhou, Y. F. Wang, X. Li, P. Song, D. N. Baker, T. A. Fritz, P. W. Daly, M. Dunlop, and A. Pedersen, Energetic electron response to ULF waves induced by interplanetary shocks in the outer radiation belt, J. Geophys. Res., 114, A10204, doi:10.1029/2009JA014393, 2009.
Boeing Corporation Commercial Communication Satellites Galaxy 15
NASA-HDBK-4002 Electron/Proton Penetration Depths (Al) Extracted from page 6 of NASA-HDBK-4002, “Avoiding Problems Caused by Spacecraft On-Orbit Internal Charging Effects
Space Weather Conditions 2. Global Environment At Earth (2 of 2) April 5th “event” as an interval of general interest 1. POES Energetic Particles (still) 3. Magnetospheric reconfiguration? ANOMALY Data Provider: USGS / Source: INTERMAGNET 4. Extreme magnetic deviations near midnight (Galaxy 15 footprint) 2. DMSP Convective Drifts (off-scale) Data Provider: GSC / Source: INTERMAGNET
Space Weather Conditions Global Environment At Earth (extra-1) 01 Oct 2005 to 01 Feb 2010 • Kp and Dst versus 1-min AL • The AL index was unusually extreme compared to the corresponding values of Kp and Dst • The Al index captures reconfigurations of Earths magnetic field on the nightside where Galaxy 15 was located • These magnetic field reconfigurations or sub-storms often inject particle radiation associated with anomalies Note: Blue crosses represent values at 09:30 UT, 5 April 2010 (closest to 09:48 UT anomaly time), where Dst =-32 nT, Kp~7.7 and AL was <= -2000 nT (from quick-look plot).
Space Weather Conditions Global Environment At Earth (extra-2) 01 Oct 2005 to 01 Feb 2010 • Same as “extra-1” – Kp and Dst versus 1-min AL with data from active day period 14-15 Dec 2006 removed • The AL index was unusually extreme compared to the corresponding values of Kp and Dst • The Al index captures reconfigurations of Earths magnetic field on the nightside where Galaxy 15 was located • These magnetic field reconfigurations or sub-storms often inject particle radiation associated with anomalies Note: Blue crosses represent values at 09:30 UT, 5 April 2010 (closest to 09:48 UT anomaly time), where Dst =-32 nT, Kp~7.7 and AL was <= -2000 nT (from quick-look plot).