Download
1 / 6
60 likes | 146 Views
Explore different methods of information visualization, such as tables, charts, and diagrams. Learn to evaluate their strengths and weaknesses, and generate guidelines for effective data presentation. Understand the difference between art and design in visualization and discover examples of successful visualizations.

E N D
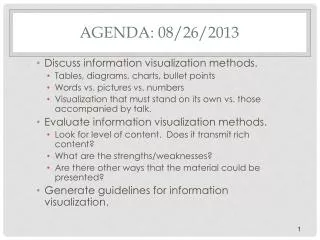
Agenda: 08/26/2013 • Discuss information visualization methods. • Tables, diagrams, charts, bullet points • Words vs. pictures vs. numbers • Visualization that must stand on its own vs. those accompanied by talk. • Evaluate information visualization methods. • Look for level of content. Does it transmit rich content? • What are the strengths/weaknesses? • Are there other ways that the material could be presented? • Generate guidelines for information visualization.
To visualize means… • To form a mental image of… • To make perceptible to the mind or imagination. • Visualization is a cognitive activity; when we visualize we perform a mental process.
Information visualization • Definitions of information visualization related to technology: • The study of how to effectively present information. • The use of computer-supported visual representations of abstract data to amplify cognition (from Readings in Information Visualization). • The purpose of information visualization is to help people think by providing different representations of data for differing contexts. • Information visualization should help: • Speed up understanding and resultant actions. • Encourage innovative ways to think about the data.
Information visualization is design, not art • Art and design are not the same. • Art is valued for its originality and expressiveness. • Art is valued for pushing the bounds of accepted norms and potentially expanding the definition of those norms. • Design is valued for its fitness to a particular user or task. • Design is valued for its effectiveness and use. • Design requires that the designer know the audience, use, task, and objectives to be accomplished.
Examples • http://www.webdesignerdepot.com/2009/06/50-great-examples-of-data-visualization/ • http://twittearth.fr/ • http://www.akamai.com/html/technology/dataviz1.html • http://www.bestiario.org/research/videosphere/ • http://newsmap.jp/ • http://www.gapminder.org/
Guidelines for information visualization • Simplicity • Ease of use • Effectiveness • Accomplishes objectives • Interest • Visually appealing • Considers audience • Flexible or interactive • Informative