8.1 Exponential Functions
8.1 Exponential Functions. ©2001 by R. Villar All Rights Reserved. Exponential Functions. Exponential Function: An equation in the form f(x) = Ca x . Recall that if 0 < a < 1 , the graph represents exponential decay

8.1 Exponential Functions
E N D
Presentation Transcript
8.1 Exponential Functions ©2001 by R. Villar All Rights Reserved
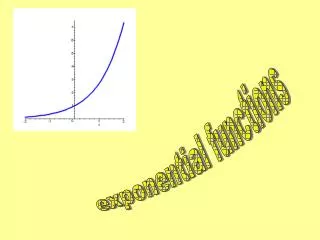
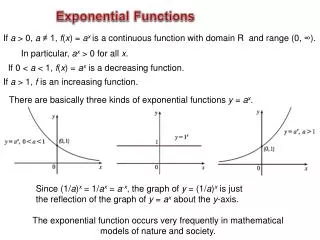
Exponential Functions Exponential Function: An equation in the formf(x) = Cax. Recall that if 0 < a < 1 , the graph represents exponential decay and that if a > 1, the graph represents exponential growth Examples: f(x) = (1/2)x f(x) = 2x Exponential Decay Exponential Growth We will take a look at how these graphs “shift” according to changes in their equation...
Take a look at how the following graphs compare to the original graph of f(x) = (1/2)x : f(x) = (1/2)x f(x) = (1/2)x + 1 f(x) = (1/2)x – 3 Vertical Shift: The graphs of f(x) = Cax + k are shifted vertically by k units.
Take a look at how the following graphs compare to the original graph of f(x) = (2)x : (3,1) (0,1) (-2,-2) f(x) = (2)x f(x) = (2)x – 3 f(x) = (2)x + 2 – 3 Notice that f(0) = 1 Notice that this graph is shifted 3 units to the right. Notice that this graph is shifted 2 units to the left and 3 units down. Horizontal Shift: The graphs of f(x) = Cax – h are shifted horizontally by h units.
Take a look at how the following graphs compare to the original graph of f(x) = (2)x : (0,1) (0,-1) (-2,-4) f(x) = (2)x f(x) = –(2)x f(x) = –(2)x + 2 – 3 Notice that f(0) = 1 This graph is a reflection of f(x) = (2)x . The graph is reflected over the x-axis. Shift the graph of f(x) = (2)x ,2 units to the left. Reflect the graph over the x-axis. Then, shift the graph 3 units down