Download
1 / 31
310 likes | 512 Views
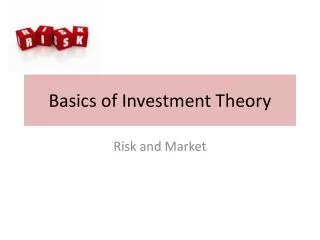
Investment Basics. Brian Doughney , CFP® Wealth Management Senior Manager. A Guide to Your Investment Options. Investment Fundamentals What Is Investing?. Investment Fundamentals - The Effect of Inflation. Purchasing Power of $200,000 at 3% Annual Inflation. $59,142. $108,759. $395,291.

E N D
Investment Basics Brian Doughney, CFP® Wealth Management Senior Manager A Guide to Your Investment Options
Investment Fundamentals-The Effect of Inflation Purchasing Power of $200,000 at 3% Annual Inflation $59,142 $108,759
$395,291 Investment Fundamentals-The Effect of Compounding Growth of Annual $5,000 Investments • $5,000 invested annually at the end of each year • 6% annual growth rate • All earnings reinvested This is a hypothetical example and is not intended to reflect the actual performance of any specific investment. Investment fees and expenses, and taxes are not reflected. If they were, the results would have been lower. “Rule of 72” 72 ÷ Rate of Return = Years Needed to Double in Value
$254,400 $120,000 $679,500 Investment Fundamentals-Sooner is Better $3,000 annual investment at 6% annual growth, assuming reinvestment of all earnings and no tax • Don’t put off investing • The sooner you start, the longer your investments have time to grow • Playing “catch-up” later can be difficult and expensive This is a hypothetical example and is not intended to reflect the actual performance of any investment. Investment fees and expenses, and taxes are not reflected. If they were, the results would have been lower.
Investment Fundamentals-Identifying Goals and Time Horizons • Investment Goals • Retirement • Education • Special purchase • Financial security • Short-term goals vs. long-term goals • In general, the longer your investment horizon, the more risks you can afford to take
Investment Fundamentals-Risk Tolerance • Ability of investment plan to absorb loss • Personal tolerance for risk • Aggressive • Moderate • Conservative
Options & Futures Common Stock Potential Return Preferred Stock Stability Corporate Bonds Government Bonds CDs Treasury Bills Growth Income Investment Fundamentals-Relationship Between Risk & Return Risk Risk-Return Tradeoff
Investment Options-Types of Investments • Cash alternatives • Bonds • Stocks • Other investments • Funds
Potential Return Cash Alternatives Risk Investment Options - Cash Alternatives • Low risk, short term, relatively liquid • Examples of cash alternatives include: • Certificates of Deposit (CDs) • Money market deposit accounts • Money market mutual funds • U.S. Treasury Bills (T-Bills)
Disadvantages Relatively low returns May not keep up with inflation Investment Options -Cash Alternatives Advantages • Predictable earnings • Highly liquid • Little risk to principal
Potential Return Bonds Cash Alternatives Risk Investment Options -Bonds • Loans to a government or corporation • Interest typically paid at regular intervals • Can be traded like other securities • Value fluctuates
Investment Options -Bonds Types of bonds include: • U.S. government securities • Agency/GSE bonds • Municipal bonds • Corporate bonds
Advantages Steady and predictable stream of income Income typically higher than cash alternatives Relatively lower-risk (compared to options such as stock) Low correlation to stock market Disadvantages Risk of default Value of bond will fluctuate with interest rates Lower risk means lower potential returns (than stock, for example) Investment Options - Bonds
Investment Options -Stocks • Shares of stock represent an ownership position in a business • Percentage of ownership determines your share of profit/loss • Earnings may be distributed as dividends • Shares of stock can be sold for gain or loss Potential Return Stocks Bonds Cash Alternatives Risk
Investment Options -Stocks • Common vs. preferred • Categories: • Small-Cap • Mid-Cap • Large-Cap • Stock terminology: • Growth stock • Value stock • Income stock • Blue chip stock
Advantages Historically, have provided highest long-term total returns Ownership rights Can provide income through dividends as well as capital appreciation Easy to buy and sell Disadvantages Poor company performance affects dividends / value of shares Subject to market volatility Greater risk to principal May not be appropriate for short-term Investment Options -Stocks
Investment Options -Other Investments • Real estate • Stock options • Futures, and commodities • Collectibles
Investment Options -Mutual Funds • Your money is pooled with that of other investors • Fund invests dollars according to stated investment strategy • You own a portion of the securities held by the fund (instant diversification)
Investment Options -Mutual Funds • Three major investment categories: • Money market funds • Bond funds • Stock funds • Mutual funds fall all along the risk / return spectrum (e.g., balanced funds, international funds) • Active vs. passive management International funds Stock funds Potential Return Balanced funds Bond funds Money market funds Risk
Advantages Diversification Professional management Small investment amounts Liquidity Disadvantages Value of shares can fluctuate daily Portion of fund dollars may be tied up in cash for liquidity needs Mutual fund fees and expenses Investment Options -Mutual Funds
Investment Options-Exchange-Traded Funds (ETFs) • Most ETFs are based on an index • Passive management may lower fund costs • Can be traded throughout the day
$35 10 shares $30 12 shares $25 15 shares $20 $15 20 shares $10 30 shares $5 $0 Jan Feb Mar Apr May Investment Methods - Dollar Cost Averaging • Invest same dollar amount at regular intervals over time • You buy more shares when price is low, fewer shares when price is high • Average cost of shares will be lower than average market price per share during your investment time period Five Hypothetical Investments Average market price per share ($30 + $10 + $20 + $15 + $25) ÷ 5 = $20 Investor’s average cost per share $1,500 invested ÷ 87 shares bought = $17.24 This is a hypothetical example and does not reflect the performance of any specific investment. Dollar cost averaging can’t guarantee you a profit or protect you against a loss if the market is declining.
Asset Allocation -Considerations Factors: • Diversification • Risk tolerance • Timeframes • Personal financial situation • Liquidity needs
Asset Allocation-Sample Allocation Model Conservative A conservative asset allocation model will tend to focus on preserving principal These asset allocation suggestions should be used as a guide only and are not intended as financial advice. They should not be relied upon. Past performance is not a guarantee of future results.
Asset Allocation-Sample Allocation Model Moderate A moderate asset allocation model will tend to balance predictable income with potential growth These asset allocation suggestions should be used as a guide only and are not intended as financial advice. They should not be relied upon. Past performance is not a guarantee of future results.
Asset Allocation-Sample Allocation Model Aggressive An aggressive asset allocation model will tend to focus primarily on potential growth These asset allocation suggestions should be used as a guide only and are not intended as financial advice. They should not be relied upon. Past performance is not a guarantee of future results.
The Role of a Financial Professional • Help you determine your investment goals, timelines, and risk tolerance • Create an asset allocation model • Select specific investments • Manage, monitor, and modify your portfolio
The Fees of a Financial Professional Sales Charges • A Share – up to 5.75% • B Share – 6 year surrender charge • C Share – 1% a year Annual Expenses • A Share – 1.2% • B Share – 1.8% • C Share – 1.5% Managed Accounts • Like a C Share • Advisor gets 1%/year • Annual Expense 1.5% • Pro: Made up of multiple mutual funds • Con: Very expensive