Download
1 / 11
110 likes | 239 Views
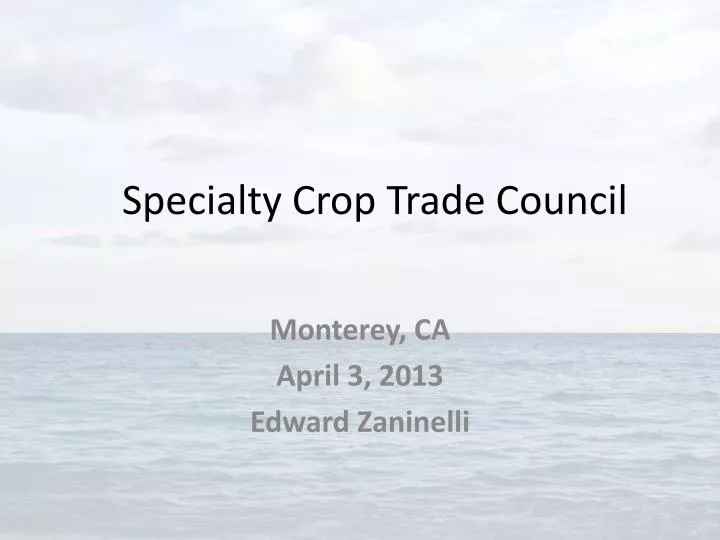
Specialty Crop Trade Council. Monterey, CA April 3, 2013 Edward Zaninelli. Landscape. Protracted period of low global economic growth North America export volumes today are the strongest in years Equipment is tight in almost all locations Demand on export space is very high

E N D
Specialty Crop Trade Council Monterey, CA April 3, 2013 Edward Zaninelli
Landscape • Protracted period of low global economic growth • North America export volumes today are the strongest in years • Equipment is tight in almost all locations • Demand on export space is very high • Mega Ships are starting to come to the W/C ports and they are more fuel efficient, and more environmentally friendly vessels • Mega Alliances – changing landscape • Most carriers still losing money
Market conditions • 2013 Transpacific (TPT) outbound growth forecast is 4-5% • 2013 Transatlantic (TAT) outbound growth forecast is 2-3% • Transpacific remains an eastbound/import driven trade • Equipment still an imbalance challenge • California has less problems than most zones with equipment
Costs Push Carriers to Save • Slow steaming and loop deployment changes – have become business as usual • Structural overcapacity W/B leads a very mixed message as carriers chase TEU volumes rather than revenue • Fuel costs continue to be high and represent the ocean carriers single highest non asset cost item • 1% low sulfur fuel 200 mile requirement for US /Canada ports now in place; 0.1% by January 2014 for California; 0.1% by January 2015 for US/Canada ports
Hard Assets in a Costly Game • Port marine terminal and on dock expansion face environmental and community hurdles • Middle Harbor Redevelopment Project as an example has a $4.6 B investment by OOCL over 40 years • Very few carriers purchased equipment in 2013 • The lack of heavy weight corridors in California do cost shippers money and efficiency • Port imbalances can impact service levels
Regulation and Admin • Carrier lead time to coordinate vessel load planning is important • Carrier and customer interaction options are growing – EDI; on line bookings, internet b/l • Forecasting by shippers and ocean carriers is a critical success factor for equipment and space management • Exception notification by carriers is important • Cancellation notification by shippers can be a huge help in cost controls
Complicated TPT W/B Market • Scope of North American inland structure is different from most the world • Even California which is all truck is challenging • The Weight of commodity products impact operations and can add costs • TEU/Market Share focus of carriers drive rates rather than cost recovery • Equipment locations are a key factor • And Service Levels are more important to SCTC shippers due to the value of your products
Size/Scale Comparison Petronas Towers, Malaysia 13,208 TEU Vessel John Hancock Center, US 8,888 TEU Vessel USS Nimitz Height 333 m 335 m 344 m 366 m 379 m