
41.6
North Carolina (Region 3) Middle School Survey. Summary Graphs. Percentage of students who:. Never or rarely wore a seat belt when riding in a car. 12.4. Ever rode with a driver who had been drinking alcohol. 23.3. Ever carried a weapon. 42.8. Ever attempted suicide.

41.6
E N D
Presentation Transcript
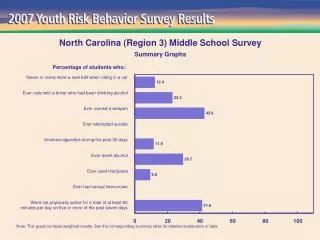
North Carolina (Region 3) Middle School Survey Summary Graphs Percentage of students who: Never or rarely wore a seat belt when riding in a car 12.4 Ever rode with a driver who had been drinking alcohol 23.3 Ever carried a weapon 42.8 Ever attempted suicide Smoked cigarettes during the past 30 days 11.6 Ever drank alcohol 29.7 Ever used marijuana 9.5 Ever had sexual intercourse Were not physically active for a total of at least 60 minutes per day on five or more of the past seven days 41.6 0 20 40 60 80 100 Note: This graph contains weighted results. See the corresponding summary table for detailed explanation of data.
North Carolina (Region 3) Middle School Survey Summary Graphs Percentage of students who: Sometimes, most of the time, or always wore a seat belt when riding in a car 87.6 Did not ever ride with a driver who had been drinking alcohol 76.7 Did not ever carry a weapon 57.2 Did not ever attempt suicide Did not smoke cigarettes during the past 30 days 88.4 Did not ever drink alcohol 70.3 Did not ever use marijuana 90.5 Never had sexual intercourse Were physically active for a total of at least 60 minutes per day on five or more of the past seven days 58.4 0 20 40 60 80 100 Note: This graph contains weighted results. See the corresponding summary table for detailed explanation of data.
North Carolina (Region 3) Middle School Survey Summary Graphs Number of students in a class of 30 who: Never or rarely wore a seat belt when riding in a car 3.7 Ever rode with a driver who had been drinking alcohol 7.0 Ever carried a weapon 12.8 Ever attempted suicide Smoked cigarettes during the past 30 days 3.5 Ever drank alcohol 8.9 Ever used marijuana 2.9 Ever had sexual intercourse Were not physically active for a total of at least 60 minutes per day on five or more of the past seven days 12.5 0 10 20 30 Note: This graph contains weighted results. See the corresponding summary table for detailed explanation of data.
North Carolina (Region 3) Middle School Survey Summary Graphs Number of students in a class of 30 who: Sometimes, most of the time, or always wore a seat belt when riding in a car 26.3 Did not ever ride with a driver who had been drinking alcohol 23.0 Did not ever carry a weapon 17.2 Did not ever attempt suicide Did not smoke cigarettes during the past 30 days 26.5 Did not ever drink alcohol 21.1 Did not ever use marijuana 27.2 Never had sexual intercourse Were physically active for a total of at least 60 minutes per day on five or more of the past seven days 17.5 0 10 20 30 Note: This graph contains weighted results. See the corresponding summary table for detailed explanation of data.