Download
1 / 10
110 likes | 272 Views
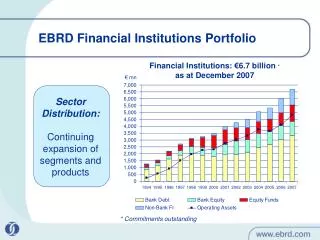
EBRD Financial Institutions Portfolio. Financial Institutions: €6.7 billion * as at December 2007. € mn. Sector Distribution: Continuing expansion of segments and products. * Commitments outstanding. EBRD’s Objectives in the Financial Sector.

E N D
EBRD Financial Institutions Portfolio Financial Institutions: €6.7 billion * as at December 2007 € mn Sector Distribution: Continuing expansion of segments and products * Commitments outstanding
EBRD’s Objectives in the Financial Sector • Promote market-based financial institutions and a healthy and efficient financial services industry • Support private and entrepreneurial initiatives of both local and foreign investors and act as a catalyst to transition • Active policy dialogue with operators and authorities to strengthen regulatory/legislative frameworks and institutions • Apply best business practices and corporate governance in institutions • Be the leader in institution building
Cumulative and Outstanding Investments (€m) Bank Equity • Since 1992 EBRD has invested in 101 banks across 27 countries for a total investment of €2.1bn. • Realised income from EBRD’s bank equity investments totalled €1.9bn so far. • As of December 2007, the portfolio comprised participations in 49 banks in 22 countries for a total investment of €982.3m. • The fair market value of this portfolio is €3.3bn, of which €2.4bn are unrealised gains. Number of Investments Note: these figures do not include EBRD’s investments in microfinance institutions
Bank Equity Returns 1992 – 2007 Overall money multiple and IRR for all investments have been 3.22x and 28.79% respectively. The average holding period for investments has been 5.5 years. €6,542m Overall MM 3.22x, IRR 28.78% UR 3.66x, 39.60% €2,839m € millions PR 3.45x, 29.76% €1,356m €2,016m FR 2.79x, 26.12% €756m €2,348m €393m €867m
Money Multiple IRR Bank Equity Performance Over Time • Number of exits has remained constant over time, ranging between 3 and 9 per year. In 2007, the EBRD made 4 exits from existing investments. • Money multiple has increased steadily since 2000 reaching an all-time high of 3.38x in 2006, and 3.23 in 2007 • The average holding period for investments has been 5.5 years. • IRRs have also increased over time, peaking in 2005 at 45.3% and remaining above average in 2007 at 28.79%. Number of Exits Total Over Period: 52 MM for the Period: 3.23x IRR for the Period: 28.79%
Bank Equity overall Performance and Returns 1992 – 2008 1Q Overall money multiple and IRR for all investments have been 3.23x and 28.65% respectively. The average holding period for investments has been 5.5 years. €6,545m Overall MM 3.23x, IRR 28.65% UR 3.72x, 39.60% €2,842m € millions PR 3.45x, 29.76% €1,356m €2,024m FR 2.71x, 26.12% €764m €2,347m €393m €867m
Insurance overall Performance and Returns 1992 – 2008 1Q Overall money multiple and IRR for all investments have been 1.84x and 16% respectively. Overall MM 1.84x, IRR 16% €652.3m € millions €2,016m €519.5m UR 1.84x, 18% €281.7m €38.3m PR 0.91, -0.36% €42.1m €94.6m FR 1.57x, 14% €60.1m
Equity Fund Returns 1992 – 2006 10,000 Fully Realised (FR Including WO) 9,000 Partially Realised (PR) Unrealised 8,000 7,000 $5,188m 6,000 Overall 2.03x, 21.07% USD Millions 5,000 FR 2.27x, 20.37% 4,000 $2,280m $1,348m PR 4.42x, 32.81% 3,000 UR 1.39x, 15.98% $305m 2,000 $2,785m 1,000 $2,009m 0 Total Value $9,321m Investments at Cost $4,595m Excluding secondary sales
Investment Criteria • Selection of partners • Commitment to: • Corporate governance • Transparency • Best practices and change • Alignment of interest
Success Factors • Institutional environment: • Rule of law • Regulatory environment • Supervision • Alignment of interests of stakeholders • Shareholders • Management • Authorities • Clients • People and commitment to high professional standards • Institution + capacity building and adapting to market dynamics