Download
1 / 4
40 likes | 166 Views
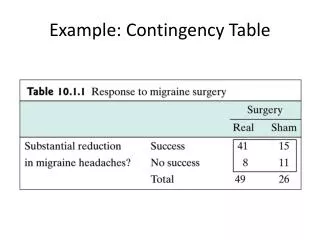
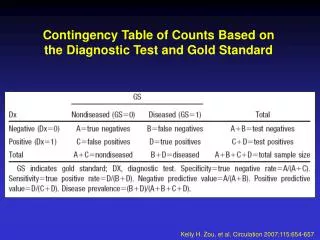
Contingency Table of Counts Based on the Diagnostic Test and Gold Standard. Kelly H. Zou, et al. Circulation 2007;115:654-657. Probability density functions of a hypothetical diagnostic test that gives values on the real line. Kelly H. Zou, et al. Circulation 2007;115:654-657.

E N D
Contingency Table of Counts Based on the Diagnostic Test and Gold Standard Kelly H. Zou, et al. Circulation 2007;115:654-657
Probability density functions of a hypothetical diagnostic test that gives values on the real line Kelly H. Zou, et al. Circulation 2007;115:654-657
Three hypothetical ROC curves representing the diagnostic accuracy of the gold standard (lines A; AUC=1), a typical ROC curve (curve B; AUC=0.85), and a diagonal line corresponding to random chance (line C; AUC=0.5). As diagnostic test accuracy improves, the ROC curve moves toward A, and the AUC approaches 1 Kelly H. Zou, et al. Circulation 2007;115:654-657
ROC curves derived from the example in firs slide using nonparametric and parametric estimation methods Kelly H. Zou, et al. Circulation 2007;115:654-657