
Correlation
Correlation. CMAP OI GPCP GPCPms MODEL 0.14 0.41 0.26 0.13 CMAP 0.10 0.58 0.29 OI 0.48 0.35

Correlation
E N D
Presentation Transcript
Correlation CMAP OI GPCP GPCPms MODEL 0.14 0.41 0.26 0.13 CMAP 0.10 0.58 0.29 OI 0.48 0.35 GPCP 0.58
Correlation CMAP OI GPCP GPCPms MODEL 0.49 -0.11 0.12 0.48 CMAP 0.36 0.42 0.41 OI 0.34 0.13 GPCP 0.42
Correlation CMAP OI GPCP GPCPms MODEL 0.34 0.01 0.00 0.37 CMAP 0.20 0.40 0.35 OI 0.35 0.27 GPCP 0.50
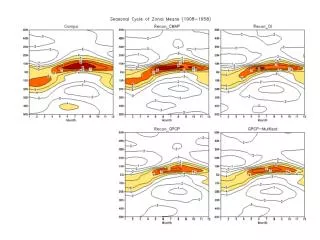
Model Recon: OI Recon: CMAP Recon: GPCP Recon: GPCPMS
(performed on monthly data) 25.5 1 Period (yrs)
What’s up with the regularity of the seasonal cycle in model global mean precip? • Asymmetric strength in NH/SH monsoon circulations • Model has overly vigorous monsoon precip. over summer • hemisphere compared to “observations”
Vigorous monsoon & western ITCZ in model
Distribution of Monthly Rain fall rates (1908-1958) Model CMAP OI GPCP GPCP- multisat 0-1 1-2 2-3 3-4 4-5 5-6 6-7 7-8 8-9 9-10 10-11 11-12 13-14 15-16 Categories (mm/day)
Model CMAP OI GPCP GPCP- multisat 15-16 17-18 19-20 21-22 23-24 >25 Categories (mm/day)


