Download
1 / 90
900 likes | 1k Views
The State Methodology for determination of freshwater inflow needs of the Texas bays. The State Methodology for determination of freshwater inflow needs of the Texas bays. Overview & Critique. Presentation to:. Science Advisory Committee. George H. Ward

E N D
The State Methodologyfor determination of freshwater inflow needs of the Texas bays
The State Methodologyfor determination of freshwater inflow needs of the Texas bays Overview & Critique Presentation to: Science Advisory Committee George H. Ward Center for Research in Water ResourcesUniversity of Texas at Austin Study Commission on Water for Environmental Flows 18 June 2004
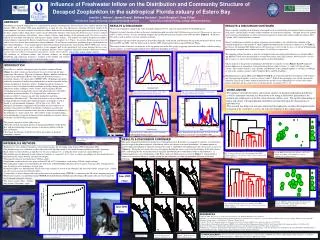
Sabine Lake Galveston Bay Matagorda Bay San Antonio Bay Aransas-Copano Bays Corpus Christi Bay Upper Laguna Madre-Baffin Bay Lower Laguna Madre
ESTUARY coastal waterbody semi-enclosed free connection to open sea influx of sea water freshwater influx small to intermediate scale
ESTUARIES transitional systems, between freshwater and marine hydrography and chemical qualities governed by both terrestrial and marine controls, as well as factors unique to estuary hydrography and chemical qualities governed by both terrestrial and marine controls, as well as factors unique to estuary terrestrial controls: freshwater influxes, flooding and inundation, runoff and inflow loads (sediment, nutrients, pollutants), and atmospheric deposition terrestrial controls: freshwater influxes, flooding and inundation, runoff and inflow loads (sediment, nutrients, pollutants), and atmospheric deposition transitional systems, between freshwater and marine marine controls: tides, waves, non-astronomical sea-level variations, marine storms, salinity, and littoral sediment influx marine controls: tides, waves, non-astronomical sea-level variations, marine storms, salinity, and littoral sediment influx predominance of these factors depends upon position in estuary: pronounced environmental gradients predominance of these factors depends upon position in estuary: pronounced environmental gradients extreme time variability in estuary extreme time variability in estuary
cross section view(longitudinal-vertical) plan view(surface horizontal)
ESTUARIES wide range in habitats spanning the estuarine zone majority of the larger animals in estuary only temporarily for specific biological purposes
ESTUARIES wide range in habitats spanning the estuarine zone majority of the larger animals in estuary only temporarily for specific biological purposes complex and shifting food webs, with frequent overlap between planktonic, pelagic and benthal communities substantial time variations in all of above factors, resulting in marked variability in community make-up and abundance abundance of specific organism depends on: population capable of entering system (i.e., abundance/health of source population, and capability to negotiate entrance into the system) availability of suitable physico-chemical conditions and/or food sources
Potential freshwater inflow effects on estuary dilutes seawater carries nutrients, trace constituents, and terrestrial sediments into estuary contributes to gradient of water properties across estuary produces inundation and flushing of important zones, due to short-term flooding variability over time creates fluctuation in estuarine properties, important to ecosystem function source of renewal water
STATE METHODOLOGY FOR DETERMINING INFLOW REQUIREMENTS OF THE TEXAS BAYS An overview & summary
Max H Specification Objective goal: Maximal harvest Species weights: equal Min Q Specification Objective goal: Minimal total annual inflows Species weights: equal
Max H Specification Objective goal: Maximal harvest Species weights: equal Constraints: Monthly inflow: >lower decile (10th percentile) <historical monthly median Bimonthly inflows:>specified values (>sum of lower decile values) Salinity: bounded by “consensus” viability limits Min Q Specification Objective goal: Minimal total annual inflows Species weights: equal Constraints: Harvest: >80% of historical mean for each species Monthly inflow: >lower decile (10th percentile) <historical monthly median Bimonthly inflows:>specified values (>sum of lower decile values) Salinity: bounded by “consensus” viability limits
FUNDAMENTAL ASSUMPTIONS OF THE STATE METHODOLOGY ECOLOGICAL HEALTH IS MEASURED BY THE ABUNDANCE OF 6-10 KEY SPECIES
For San Antonio Bay, the 7 key species are: blue crab brown shrimp oyster white shrimp red drum black drum spotted seatrout
For Galveston Bay, the 8 key species are: blue crab brown shrimp oyster white shrimp red drum black drum spotted seatrout flounder
For Sabine Lake, the 8 key species are: blue crab brown shrimp menhaden white shrimp red drum croaker spot speckled trout
FUNDAMENTAL ASSUMPTIONS OF THE STATE METHODOLOGY ECOLOGICAL HEALTH IS MEASURED BY THE ABUNDANCE OF 6-10 KEY SPECIES ABUNDANCE IS PROPORTIONAL TO, HENCE MEASURED BY, THE ANNUAL COMMERCIAL HARVEST
Advantages of harvest as a measure of abundance: the data are quantitative and consistently measured the data represent the catch integrated over large aquatic areas, so the effect of spatial variability should be averaged out a long period of record of annual harvests is available extending back in some cases five decades the harvest measures one of the direct economic benefits of the resource of an estuary
Disadvantage of harvest as a measure of abundance: Harvest is affected by factors having no relation to abundance: regulation of the fishery location, catch and processing technology of the fleet skill of the fisherman market and economics external stresses on the species population
FUNDAMENTAL ASSUMPTIONS OF THE STATE METHODOLOGY ECOLOGICAL HEALTH IS MEASURED BY THE ABUNDANCE OF 6-10 KEY SPECIES ABUNDANCE IS PROPORTIONAL TO, HENCE MEASURED BY, THE ANNUAL COMMERCIAL HARVEST ABUNDANCE IS QUANTIFIED ENTIRELY BY 6 BIMONTHLY FLOWS, TOTALLED OVER THE ENTIRE BAY
6 independent flow variables ( “seasonal” flows): Jan + Feb Mar + Apr May + Jun Jul + Aug Sep + Oct Nov + Dec each computed by: Inflow = Gauged + Ungauged - Diversions + Returns (summed over the entire bay)
FUNDAMENTAL ASSUMPTIONS OF THE STATE METHODOLOGY ECOLOGICAL HEALTH IS MEASURED BY THE ABUNDANCE OF 6-10 KEY SPECIES ABUNDANCE IS PROPORTIONAL TO, HENCE MEASURED BY, THE ANNUAL COMMERCIAL HARVEST ABUNDANCE IS QUANTIFIED ENTIRELY BY 6 BIMONTHLY FLOWS, TOTALLED OVER THE ENTIRE BAY ABUNDANCE VARIES IN PROPORTION TO THE BIMONTHLY BAY-TOTAL FLOWS (perhaps log transformed)
the relationship can be extracted by linear regression harvest is completely determined by the levels of inflow for a given year (apart from perhaps lagging harvest behind inflow based upon the grow-out time of the species): there is no memory there is no substantial effect of recruitment or dynamics of the Gulf stock recreational harvest is irrelevant
HARVEST REGRESSIONS FOR SAN ANTONIO BAY H = annual commercial landings, thousands of pounds Qab = total bimonthly inflow, ac-ft, for sequential months a and b Crab: H = 110.64 – 145.3 ln(QJF) + 332.5 ln (QJA) – 141.4 ln(QSO) Oyster: H = 3000.7 + 180.4 ln(QMA) – 963.3 ln(QMJ) + 710.0 ln(QJA) – 231.5 ln(QSO) R.drum: H = 32.786 + 0.0797 QMJ + 0.2750 QJA - 0.2010 QND B.drum: H = -18.087 + 0.2411 QJF - 0.1734 QMA + 0.0850 QND Trout: ln(H) = 2.6915 – 0.7185 ln(QMA) + 1.860 ln(QMJ) – 1.086 *ln(QND) B. shr: ln(H)= 6.5679 + 0.6707 ln(QJA) – 0.7486 ln(QSO) W. shr: H = 545.59 + 160.9 ln(QJF) + 279.1 ln(QMJ) – 155.1 ln(QJA) – 277.9 *ln(QND)
HARVEST REGRESSIONS FOR GALVESTON BAY H = annual commercial landings, thousands of pounds Qab = total bimonthly inflow, ac-ft, for sequential months a and b Crab: H = 751.23 - 0.2756 QJF + 0.8464 QMA - 0.139 QMJ - 0.4747 QSO + 0.6001 QND Oyster: H = 4169.8 - 0.9397 QJF +0.2838 QMJ - 0.9445 QJA Brown shrimp: H = 1019.8 - 0.5779 QJF + 0.4192 QJA + 0.4060 QSO + 0.3533 QND White shrimp: H = 3212 - 0.6905 QJF + 0.2734 QMA - 0.3254 QJA + 0.5046 QND Flounder: H = -12.122 - 0.0309 QJF + 0.0541 QJA + 0.0494 QND Red drum: ln H = 3.1548 + 3.92E-4 QMJ - 2.04E-3 QJA + 6.98E-4 QSO Black drum: H = 50.225 - 0.02985 QJF + 0.1040 QJA - 0.0639 QSO + 0.0329 QND Seatrout: ln H = 8.2764 - 1.8241 ln QJF +1.425 ln QND
FUNDAMENTAL ASSUMPTIONS OF THE STATE METHODOLOGY ECOLOGICAL HEALTH IS MEASURED BY THE ABUNDANCE OF 6-10 KEY SPECIES ABUNDANCE IS PROPORTIONAL TO, HENCE MEASURED BY, THE ANNUAL COMMERCIAL HARVEST ABUNDANCE IS QUANTIFIED ENTIRELY BY 6 BIMONTHLY FLOWS, TOTALLED OVER THE ENTIRE BAY ABUNDANCE VARIES IN PROPORTION TO THE BIMONTHLY BAY-TOTAL FLOWS (perhaps log transformed) OPTIMUM FLOWS ARE NECESSARY FOR MAINTENANCE OF ECOLOGICAL HEALTH