Download
1 / 40
400 likes | 524 Views
Welcome to. An Introduction to The Network for a Healthy California GIS Viewer. Webinar. Anthony Barnes Bhavdeep Sachdev. 9:00am to 10:30am. Agenda. Module 1 : Basic Tools. Module 2 : Advanced Tools. Module 3 : Demographics and Qualifying Census Tracts.

E N D
Welcome to An Introduction to The Network for a Healthy CaliforniaGIS Viewer Webinar Anthony Barnes Bhavdeep Sachdev 9:00am to 10:30am
Agenda Module 1: Basic Tools Module 2: Advanced Tools Module 3: Demographics and Qualifying Census Tracts Questions: Please send a chat message to Bhavdeep with any questions and we will answer at the end of each module. If you have an immediate question to something I am doing on the screen, raise you hand in the chat, and I will answer it. This webinar includes demonstrations on how to use the site. We recommend that you not follow along because the web site can slow down when too many people are using it simultaneously.
Module 1:Basic Tools and Site Layout • Learning objectives: • GIS and Data Layer Types • Map Menu and Tools • Layer List and Tabs • Jump to a New Location • Summarize Data
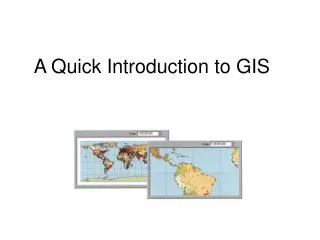
What is GIS and Why Do We Use It? • Geographic Information System (GIS) is a system that captures, stores, and presents data that are linked to a location. • Data is presented in layers over a map to show spatial relationships. These are called data layers. • The Network for a Healthy California uses GIS to target specific communities and plan appropriate interventions. • A feature is another way to refer to an active data layer on the map. There are three types of features.
Data Layer Types Point Features : ie: Schools, Grocery Stores, or Fast Food Most common feature we have. Line Features : ie: Streets, Highways Least common feature, only roads. Polygon Features : ie: Counties, Census Tracts or Population Centers, Zip Codes.
Module 2:Advanced Tools (Buffers, Locate, Draw) • Learning objectives: • Locating specific locations on the map, • Drawing a custom location on the map, and • Buffering a location or selected feature.
Locate/Address Search Represents your location
Location or selected feature to be buffered Buffering: How does it work? Target feature to be selected in the buffer. i.e: Schools or Grocery Stores. Buffer around location of a Designated distance. Map Window Target features found within the buffer. A table Is created from these. 1 Mile
Location or selected feature to be buffered Target feature to be selected In the buffer. i.e: Schools or Grocery Stores. Buffer of a designated Distance. Target feature found within the buffer. A table Is created from these. Step 1: Determine the type of location you want to buffer. Buffer Location or Buffer Selected Features Selected Feature: Select features using the Select Tool Location: Address Search or Draw Point. Always uses this icon
Location or selected feature to be buffered Target feature to be selected In the buffer. i.e: Schools or Grocery Stores. Buffer of a designated Distance. Target feature found within the buffer. A table Is created from these. Step 2: Determine the distance of the buffer
Location or selected feature to be buffered Target feature to be selected In the buffer. i.e: Schools or Grocery Stores. Buffer of a designated Distance. Target feature found within the buffer. A table Is created from these. Step 3: Pick the target feature you want to find within a buffer distance.
Location or selected feature to be buffered Target feature to be selected In the buffer. i.e: Schools or Grocery Stores. Buffer of a designated Distance. Target feature found within the buffer. A table Is created from these. Step 4: Select “Return attribute data” to have a results table pop up when you buffer. Step 5: Click the “Draw Buffer” button
Draw Point Tool You can create a location point wherever you want to run a buffer.
Module 3:Determining Qualified Census Tracts • Learning objectives: • What is a qualified census tract and why is it necessary? • What is the difference between a census tract and a block group? • ACS, Census 2000 and 2010 boundaries • Using an address to determine eligibility • What Demographics does our site have? • Case Studies Demo
Qualified Census Tracts • What is a qualified census tract? • A qualified census tract is a tract in which at least 50% of the targeted population is under the 185% Federal Poverty Level • Example: • A tract has a Total Population of 10,000. • It has 6000 (60%) people under the 185% Federal Poverty Level. • It is qualified. • Why is it necessary to determine eligibility of a census tract? • This helps ensure that targeted populations are low income. • USDA requires that funding be targeted only to snap eligible populations and other low-income households, with incomes at or below 185% of the Federal Poverty Level.
Census and American Community Survey • What is ACS and what is the difference between the Census every 10 years? • In 2000, the US Census released a long form which included poverty levels. • In 2010, the US Census did NOT include the long form. • ACS is a survey that takes place every year. It includes data that the 2010 census did not collect. • The sample size is smaller so ACS data are actually estimates and have margins of error. • The data is organized into 5 year estimate totals. The most recent is 2006 – 2010. The previous and first release was 2005 – 2009.
2000 and 2010 Census Boundaries • Why are they different? • As the population in a census tract changes, one of three things can happen. • 1) It can split into more tracts (If the population increases) • 2) It can merge with others (If the population decreases) • 3) It can stay the same (If the population doesn’t have a large change) • What else has changed? • More then 50% of 2000 census tracts have had their boundaries changed in some way in 2010, but that is not the only thing that is different. Census Tract numbers will have changed as well. • What tracts should I use? • Always use the most current census tracts (Census 2010)
Revisions Note: Sometimes the tract number can change, even with minor changes
Demographic Layers • What is there? • Population/Ethnicity (Census 2000 data, Census 2000 boundaries) • Economic Indicators (ACS 2006 – 2010 data, Census 2010 boundaries) • Economic Indicators (ACS 2005 – 2009 data, Census 2000 boundaries) • CalFresh Indicators (DHCS data, Census 2000 boundaries) • Old Economic Indicators (Census 2000 data, Census 2000 boundaries) <- Updated recently
What is the difference census tracts and block groups? Tract Number: 06067004004 State: 06 County: 067 Census Tract: 004004 (4004) Tract Number: 060670040042 State: 06 County: 067 Census Tract: 004004 (4004) Block Group: 2 • What types of data do they have? • Both have Federal Poverty Levels for • all races. • Census Tracts have Federal Poverty Levels for individual races • Block groups have household income • and median home prices.
Thank you! Training Videos for these modules will be posted on the front page of www.cnngis.org and http://gis.cdph.ca.gov/cnn/ If you have any further questions, or suggestions about this webinar please contact us at. Anthony Barnes: (916) 445-2835 or e-mail Anthony.Barnes@cdph.ca.gov Bhavdeep Sachdev: (916) 445-2834 or e-mail Bhavdeep.Sachdev@cdph.ca.gov Survey