Download

1 / 1
20 likes | 108 Views
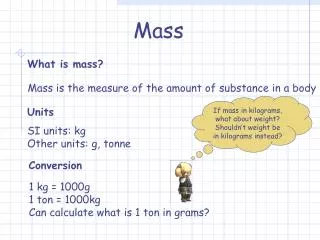
This study investigates bone mass variations in girls and mothers across different age groups relative to menarche, analyzing the impact of lean mass and fat mass.

E N D
4 4 3 3 Bone mass (kg) Bone mass (kg) 2 2 1 1 -60 -60 -60 -40 -40 -40 -20 -20 -20 0 0 0 20 20 20 40 40 40 60 60 60 80 80 80 100 100 100 120 120 120 Age 11.2-yr Age 11.2-yr Age 11.2-yr Age 18.3-yr Age 18.3-yr Age 18.3-yr Age 44.8-yr Age 44.8-yr Age 44.8-yr Time relative to menarche (months) Girls Girls Girls Mothers Mothers Mothers 60 60 60 60 45 45 45 45 Leam mass (kg) Leam mass (kg) 30 30 30 30 15 15 15 15 0 0 0 0 Time relative to menarche (months) Fat mass (kg) Fat mass (kg) Time relative to menarche (months)