Download
1 / 26
390 likes | 1.21k Views
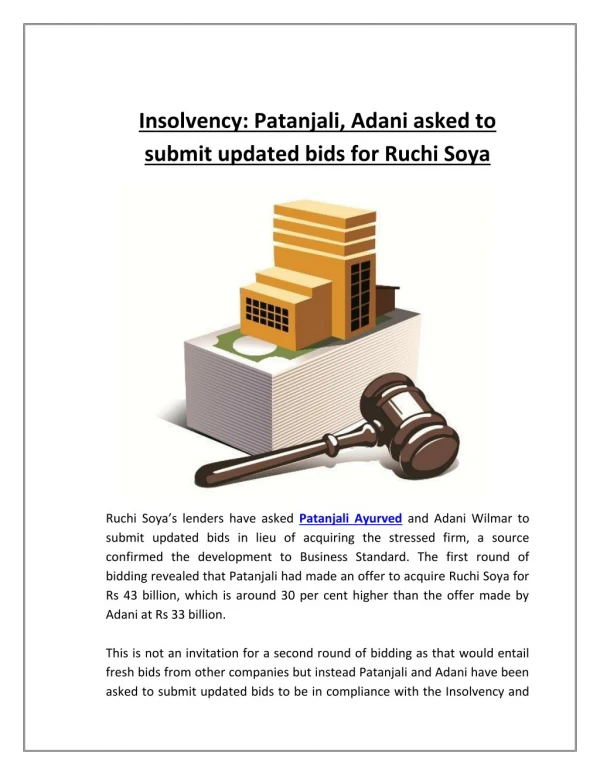
Ruchi Soya Industries Limited Corporate Presentation. Disclaimer. By attending the meeting where this presentation is made, or by reading the presentation slides, you agree to be bound by the following limitations:

E N D
Disclaimer By attending the meeting where this presentation is made, or by reading the presentation slides, you agree to be bound by the following limitations: • This document has been prepared for information purposes only and is not an offer or invitation or recommendation to buy or sell any securities of Ruchi Soya Industries Limited (the "Company“ or “Ruchi Soya”), nor shall part, or all, of this document form the basis of, or be relied on in connection with, any contract or investment decision in relation to any securities of the Company. • This document is strictly confidential and may not be copied, published, distributed or transmitted to any person, in whole or in part, by any medium or in any form for any purpose. The information in this document is being provided by the Company and is subject to change without notice. The Company relies on information obtained from sources believed to be reliable but does not guarantee its accuracy or completeness. • This document contains statements about future events and expectations that are forward-looking statements. These statements typically contain words such as "expects" and "anticipates" and words of similar import. Any statement in this document that is not a statement of historical fact is a forward-looking statement that involves known and unknown risks, uncertainties and other factors which may cause our actual results, performance or achievements to be materially different from any future results, performance or achievements expressed or implied by such forward-looking statements. None of the future projections, expectations, estimates or prospects in this document should be taken as forecasts or promises nor should they be taken as implying any indication, assurance or guarantee that the assumptions on which such future projections, expectations, estimates or prospects have been prepared are correct or exhaustive or, in the case of the assumptions, fully stated in the document. The Company assumes no obligations to update the forward-looking statements contained herein to reflect actual results, changes in assumptions or changes in factors affecting these statements. • You acknowledge that you will be solely responsible for your own assessment of the market and the market position of the Company and that you will conduct your own analysis and be solely responsible for forming your own view of the potential future performance of the business of the Company. • This document speaks as of March 31, 2012. Neither the delivery of this document nor any further discussions of the Company with any of the recipients shall, under any circumstances, create any implication that there has been no change in the affairs of the Company since that date Page 1
Slide No. Overview of Ruchi Soya 4 Key Highlights 8 Global & Domestic Industry Scenario 9 Integrated Operations 12 Brand Offerings 13 Management 16 Business Strategy 18 Financials 21 index Page 3
Overview of Ruchi Soya Company Profile Capacity growth (Mn MT/Yr) • One of the leading manufacturers of high quality edible oils, vanaspati, bakery fats and soya foods in India • Consolidated Annual turnover of over US$ 5.9 Bn(1)(2)in FY12 • Among the top Indian FMCG players • Branded portfolio including Nutrela, Ruchi Gold, Sunrich and Mahakosh • Present across the value chain with access to over 185,000 hectares of land in India for palm oil plantations • Listed on BSE (500368) & NSE (RUCHISOYA) • Ongoing discussions for securing land for soya / palm plantation in geographies including Ethiopia and Cambodia and other geographies Crushing: CAGR 1998-2012: 15% Refining: CAGR 1998-2012: 24% Vanaspati: CAGR 1998-2012: 17% Growing Sales (2) Revenue mix (FY12) Revenues (INR Bn) Page 4 • Assuming INR/USD of 51.15 • On the basis of consolidated financials.
Edible oil segment The Company has a strong position in the edible oil segment with an estimated market share of ~18%. The company has attained leadership position in ROCP category with market share of ~ 15.5%, the company has also witnessed growth over the last 3-4 years in the institutional segment, which caters to institutional customers like, Parle, Britannia Industries, Cadbury India, Nestle India, Lotte India, Bunge India, and ITC Ruchi Soya edible oil sales(1) Ruchi Soya edible oil market share(2) 000’MT % Ruchi soya edible oil segment: CAGR FY07–FY12: 20% Indian edible oil: CAGR FY07–FY12: 7% Source: USDA FAS Page 5 • Standalone sales of edible oil segment of Ruchi Soya Industries Ltd.; excludes the sales for captive consumption • 2. Market share estimated based on edible oil sales of Ruchi Soya and Industry edible oil consumption based on USDA FAS data • P - provisional
Evolution of Ruchi Soya Revenue CAGR 2001- 2012: 25% • Primary focus on inland crushing • High proportion of revenue from trading activities • Expansion of extraction and refining capacity • Focus on branded products • Increased port based refining • Focus on developing upstream business • Secure access to 185,000 ha of palm plantation in India • Major refining capacity expansion in 2012 • Efforts to secure international land bank access underway Page 6
Key Highlights Favourable Industry Dynamics Scale & Extensive Distribution Reach in India Strong Market Position in Edible Oils in India Experienced Management Strong Brands in India Strong Risk Management Fully Integrated Operations Page 8
Indonesia 19% Other 26% Malaysia 13% India 5% Argentina 6% United China States 13% Europe 7% 11% 5% 4% 43% 17% 14% 9% 7% Palm Soyabean Rapeseed Peanut Cottonseed Sunflower seed Other Global Industry Overview India is a leading consumer of edible oil with high growth expectation World Edible Oil Consumption (FY12) World Edible Oil Production (FY12) Indonesia Argentina Source: USDA FAS Palm and Soyabean oil constitute ~61% of the Global Edible Oil Demand FY07-FY12 CAGR 3% 3% 7% 3% 6% Source: USDA FAS Source: Global Edible Oil Demand as per USDA FAS Page 9
India Edible Oil Industry: High growth potential Robust growth in consumption of edible oil .... Rising deficit with domestic production not being able to keep pace Significant growth in per capita consumption can be expected as Indian per capita GDP continues to grow US$ Mn Source: USDA FAS, IMF Source: USDA FAS, IMF Source: USDA FAS, IMF CAGR Imports: 9% CAGR Production : 4% Source: USDA FAS Source: USDA FAS India Imports India Production Edible oils have a significant share in Indian agricultural imports …getting turbo charged by growing per capita income Oil Consumption growing inline with growth in population … Indian Edible oil demand being substantially met by imports as domestic production has lagged Page 10
India Edible Oil Industry: High growth potential (Cont’d) Palm oil consumption in India has seen significant growth, and is primarily met through imports, leaving significant room for growth in domestic production India Edible Oil Consumption FY07-FY12 CAGR FY07-FY12 CAGR 7% 16279 16,862 14% 15,853 14,559 12,970 11,807 5,917 5,440 19% 15% 15% India Edible Oil Imports Source: USDA FAS (Office of Global Analysis) as at July ‘12 Source: USDA FAS (Office of Global Analysis) as at July ‘12 Page 11
Fully Integrated Operations Healthy mix of midstream and downstream, and well on its way to develop an upstream business Information flows / Visibility across value chain Origination Processing Products Merchandising and distribution Customer Finance / Risk management / Logistics coordination Page 12
Strong Brands in India Track record of successfully creating brands in a highly commoditized industry Branded Sales Key Brands Premium 5 Year CAGR of 19 % Value Mass Page 13
Scale & Extensive Distribution Reach in India Strategically located facilities striking the right balance between proximity to raw materials (cultivating states and ports) and proximity to markets, with an aggregate daily crushing capacity of 13,400 MT of oilseeds and aggregate refining capacity of 9567 MT of oil Pan India Presence Manufacturing locations 1 Jammu Parwanoo Amritsar Damtal Rajpura Dehradun 2 Ludhiana Chandigarh Roorkee Bhatinda Karnal Meerut Gurgaon Delhi Barelly Sriganganagar Saharanpur Hapur Rewari Jaipur 3 Agra Allahabad Kanpur Baran Guwahati Jodhpur Gorakhpur Daloda Kota Sumerpur 15 Varanasi 4 Patna 8 Udaipur Dhanbad Shujalpur Raniganj 7 Gwalior 12 Siliguri Guna Manglia 5 Ahmedabad Gaderwada Ranchi Haldia 11 10 Piparia Indore Kandla 9 Kolkata Sambalpur Jeypore Raipur 6 13 Washim Nashik 14 Cuttack Nagpur Pune Bilaspur Mumbai Bhiwandi 16 Warangal Vijaywada Patalganga Gulbarga Berhampur Davangere Hyderabad Bijapur Vizag Belgaum Ongole Kurnool Goa Tirupathi Highlights Bellary 17 19 Kakinada Manglore 18 Depot Banglore Pan India Footprint Shimoga Chennai Hassan Vellore Hubi Plantlocation Villupuram Mysore Kasargod Pondicherry Office Salem Calicut Kumbakonam Cochin Trichy Madurai Palghat Proximity to Ports Erode Coimbatore Crushing in Soya bowl of India Page 14 Note: Distribution network as of March 2011 ;
Strong Risk Management The company has effectively maintained revenue growth and profitability in spite of the volatility of commodity cycles, over the last decade Consolidated Revenues (INR Bn) Consolidated EBITDA (INR Mn) Page 15 Source: IMF Rapeseed refers to - Rapeseed Oil; Crude, fob Rotterdam Soya refers to - Soybean Oil, Chicago Soybean Oil Futures (first contract forward) exchange approved grades, US$ per metric tonne Palm refers to - Palm oil, Malaysia Palm Oil Futures (first contract forward) 4-5 percent FFA, US$ per metric tonne
Experienced Management • Experienced management team with over four decades of industry experience • Credited with the growth and development of the soya and soya processing industry in India • Key members have served or are currently serving as officers of various industry bodies, recognizing their standing in sector Core Management Team • Managing Director of Ruchi Soya Industries Ltd. since 1986 • Over 32 years of experience in the soya and edible oil industry • Also serves as a Non Executive Director of Ruchi Infrastructure Ltd. • Mr. Shahra holds a degree of Bachelors in Chemical Engineering Mr. DineshShahra Managing Director Mr. NiteshShahra President, Refinery Business • Responsible for operations in all the port based refineries • Over 19 years of experience in the relevant operations, including in Ruchi Soya since 2006 • Mr. Shahra holds a degree of Bachelors in Commerce and Masters in Business Administration Mr. V. Suresh Kumar Head, Corporate Finance Mr. RV Ramanujam Chief Operating Officer • Over 26 years of experience, including ~18 years in Ruchi Soya • Responsible for Finance and Treasury operations • Qualified chartered accountant, cost accountant and company secretary • Joined Ruchi Soya Industries in 2009 • Previous experience includes 16 years in Asian Paints (holding positions including, Regional Head-S.Pacific, China & Hongkong and CEO for Bangladesh and Dubai) and 4 years in ITC Ltd. (Agri Business) Page 16 Source: Company.
1st 1st 2nd 2nd 1st 1st 2nd Strong Market Position in Edible Oils in India Among the oldest and most established edible oil players in India Awards to the Company Select Awards Received • Largest Food & Agriculture Company in India – Fortune India 2010 & 2011. • One of the only two Indian Companies featured in the “World's 50 fastest growing consumer firms” during the June 2009-June 2010 period. • Ranked “20th fastest growing consumer companies” across the globe during June 2009-10 – Deloitte Exports/Imports National energy conservation awards • Among the leading importers of edible oil • Among the leading exporters of meal/oil seed extracts • Edible oil / Vanaspati • Chennai Plant (2007) • Gujarat plant (2008) • Karnataka Plant (2009) • Chennai Plant (2008) • Nagpur Plant (2011) Capacity Market Position in India(1) • Among the largest capacities • Crushing capacity (13,400 MT/day) • Refinery capacity (9567 MT/day) • Access to one of the largest palm oil plantations in India Management awards Ruchi soya awards • No.1 M.D. for 2010 by Business World • -Dinesh Shahra • Globoil man of the year 2010 • Nitesh Shahra • Globoil man of the decade award in the year 2006 • Dinesh Shahra • Legend of the year 2003 • Kailash Shahra • Highest exporter of oil meals (2011/10/ 09 / 07 / 06 / 04 / 03 / 00 / 99 / 98) • Highest importer of edible oil (2011/10/ 09 / 07 / 06 / 03 / 98) • “Best Wind Farm in India” (>2Mw) at Intl. Wind Energy Conference. • Outstanding Performance for a decade in Import of edible oil (09) • Outstanding Performance for a decade in Export of oil meal (09) Branded Products Globoil gold & Other awards • One of the leading Indian Edible oil players in terms of Volumes • Very strong position in Palmolein Oil • Extensive portfolio of brand sales in edible oil segment (1) Based on company estimates Page 17
Business Strategy Backward Integration Expansion & Consolidation of installed capacity Greater focus on branded portfolio Increasing Global Presence Page 18
Market and Ownership Overview Top Holders (1) Shareholding Pattern (1) Capital Market Data Indexed Stock Price Performance - 5 years 158% Page 20 • Source: Company filings
Summary Financials – Consolidated Page 21 • Source: Company filings • (* ) Including short term loans of INR 30991 Mn, (FY12) & INR 17616Mn (FY11) which are guaranteed by banks against fixed deposits in the banks • (#) Figures are as per the revised schedule VI requirements. • Share capital takes into account redemption of preference shares capital in FY 10 , conversion of share warrants and share capital suspense on amalgamation into equity shares in FY 11. • Includes increase on account of revaluation of fixed assets pursuant to scheme of amalgamation
Summary Financials - Consolidated EBITDA Revenues INRBn 5year CAGR of 27% 5 year CAGR of 28% Net Worth(1) Total Assets 5year CAGR of 28% 5year CAGR of 20% Page 22 • Source: Company Filings • Net Worth takes into account the redemption of preference shares and revaluation of fixed assets pursuant to scheme of amalgamation. • # Figures as per the revised schedule VI requirements.
Process Flow Diagram Soybean extraction plant Beans Cleaning, Cracking, Dehulling, Conditioning, Flaking Full Flat Flakes Oil Extraction Toasting Crude Soyabean oil Defatted Soya Flakes Grinding/Grading Refining Grinding Soya Flour Refined Soya Oil Soya Meal Extrusion Hydrogenation Textured Soya Protein Vanaspati Page 23
Abbreviations Page 24