Download
1 / 87
1k likes | 1.55k Views
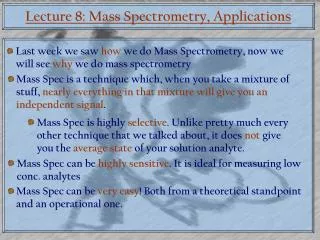
醫學新知導論 Mass Spectrometry in Biotechnology/Proteomics. Yi-Ting Chen ( 陳怡婷 ), Ph.D. Molecular Medicine Research Center Chang Gung University Nov. 5 , 200 9. Outline. Introduction of mass spectrometry principle Instrumentation Proteomics Introduction Mass spectrometry in proteomics

E N D
醫學新知導論Mass Spectrometry in Biotechnology/Proteomics Yi-Ting Chen (陳怡婷), Ph.D. Molecular Medicine Research Center Chang Gung University Nov. 5, 2009
Outline • Introduction of mass spectrometry • principle • Instrumentation • Proteomics • Introduction • Mass spectrometry in proteomics • Protein identification • Quantitative proteomics • Post-translational modification • Application of mass spectrometry in biotechnology • Food science • Environment chemistry • Drug analysis
MS WHAT IS A “MASS SPECTROMETER ”...?
CRIMS MALDI LC/MS QTOF quad. APCI FAB TOF ESI ESI ESI EI ESI FT-ICR LC-MSMS qQTOF Ion trap SELDI …many black boxes ! The black box problem…...
“A mass spectrometer measures the molecular weight….” “...A MS analysis gives the mass-to-charge ratio (m/z) of ions…in gas phase”.
TOF, quadrupole, Ion trap, FT, magnetic sector QQQ, Q/TOF, Q/IT… Pumping system vacuum Ion Source Analyzer ion separation Sample introduction Introduction (solid, liquid, gas) Separation technique (HPLC, CE, GC) Detector Data Processing ESI, nano ESI, MALDI, FAB, EI, CI, APCI, SIMS…
Matrix Assisted Laser Desorption Ionization (MALDI) Nd:YAG Laser 355 nm Sample & matrix Sample plate hn To Mass Analyzer Sample ions, MH+ High voltage Ground Grid
Molecular Weight 1000000 ESI 1000 APcI 600 EI HPLC - MS • Ion Source (離子源) • 大氣壓下游離法 (Atmospheric Pressure Ionization, API) • 電灑法 • Electro-spray, ESI • 大氣壓化學游離法 • Atmospheric Pressure Chemical Ionization, APCI Analyte Polarity
泰勒錐 Taylor cone Cone voltage Desolvation pumping Electro-spray, ESI (電灑法)
HPLC - MS • Electro-spray, ESI (電灑法) Ions evaporate from the surface Capillary ~3 kV Solvent evaporation Coulombic explosion As droplets evaporate, the electric field increases and ions move towards the surface.
MALDI-TOF spectra of apomyoglobin Sample: 1 pmole apomyoglobin (horse skeletal muscle) INSTRUMENT: Kratos Axima-CFR
+15 +17 +18 +16 100 998.1 1131.0 942.8 1060.4 +14 +19 80 893.2 1211.7 +20 +13 848.6 1304.8 60 +21 Relative Abundance 808.2 +12 +22 16951.5 40 1413.5 +11 771.5 +23 100 1541.8 +9 +10 738.0 +24 20 1695.9 1884.5 707.4 +25 80 679.1 +9 60 1884.3 Relative Abundance AFTER DECONVOLUTION 0 400 500 600 700 800 900 1000 1100 1200 1300 1400 1500 1600 1700 1800 1900 2000 40 m/z 20 Sample: 1 pmole apomyoglobin (horse skeletal muscle) 0 16000 16400 16800 17200 17600 18000 18400 mass INSTRUMENT: Thermoquest LCQ-classic ESI-ion trap spectra of apomyoglobin ACTUAL SPECTRUM
Fourier-transform Ion Cyclotron Resonance (FT-ICR) High resolution and accuracy
ESI and APCI differ in… • How ions are generated • ESI - solution phase ionization • APCI - gas phase ionization • Analyte compatibility • ESI - polar compounds and large biomolecules • APCI - less polar, smaller compounds (relative to those ionized by ESI) that have some volatility • Flow rate compatibility • ESI - 0.001 to 1 mL/min • APCI - 0.2 to 2 mL/min
100 50 Relative intensity APCI ESI 0 0.5 1.0 1.5 2.0 Flow rate (ml/min) (50/50 ACN/H20) HPLC -MS • Effect of Flow Rate
To Detector X - + + Y - Voltage on Rods -ve 0 +ve X ß à Y From Source RF Cycle HPLC -MS • Quadrupole
MALDI Time-of-flight (TOF) MS The ions enter the flight tube with the lighter ions travelling faster than the heavier ions intensity Laser Mass (m/z) TOF source
Fourier-transform Ion Cyclotron Resonance (FT-ICR) High resolution and accuracy
Resolution = 18100 8000 15 ppm error 6000 Resolution = 14200 4000 Counts 24 ppm error Resolution = 4500 2000 0 55 ppm error 2840 2845 2850 2855 Mass (m/z) Resolution & mass accuracy on mellitin
m1 m2 m4 m3 m2 m1 m4 m3 mass scanning mode m1 m2 m2 m2 m2 m2 m4 m3 single mass transmission mode Single MS Analyzer m/z
3. The ions are filtered in MS1 according to their mass to charge ratio (m/z) 4. The mass separated ions undergo CID in the hexapole collision cell 5. The fragment ions are filtered in MS2 according to their mass to charge ratio 2. Ions are transferred to the analysers through a hexapole lens 1. Samples from the liquid introduction system enter the ionisation source at atmospheric pressure 6. The ions are detected by an off-axis photomultiplier detector. HPLC-MS/MS Triple Quadrupole
Collision Chamber (gas) + m1 m2 + + + m4 m2 m2 m2 m2 + + + + m3 + + N2 + mass scan mode single mass transmission MS/MS Scan Functions Q1 Q3 Product Ion Scan (PI) Fix Scan Multiple Reaction Mode (MRM) Fix Fix Precursor Ion Scan (PS) Scan Fix Neutral Loss Scan (NL) Scan Scan
Collision Chamber (gas) + m1 m2 + + m2 m2 m2 m2 m4 + + + + m3 + + N2 + mass scan mode single mass transmission Product Ion Scanning
Parked on Precursor ion Parked on a product Ion CAD Q1 Q2 Q3 Fundamental to Absolute Quantitation is the Triple Quad Scan termed Multiple Reaction Monitoring (MRM) • Most sensitive scan type for detection of known components - Q1 is set on the parent ion m/z (usually multiply charged for peptides) - ions are fragmented in Q2 collision cell - Q3 is set on the diagnostic fragment m/z
Precursor Ion Scanning Scan Precursors Select Product CAD Q2 Q1 Q3 Only ions passed through Q1 that produce thePTM-specific fragment mass (e.g. 79 for phosphorylation or 204 for glycosylation)will produce signal at the detector
Proteomics • Introduction • Mass spectrometry in proteomics • Protein identification • Quantitative proteomics • Post-translational modification
Proteome : In 1993, the term “Proteome”, by Marc Wilkins and Keith Williams, was referred to the systematic identification of the entire protein population expressed by a genomeor by a cell or tissue type. • Proteomics : The subject of proteomic analysis of the proteome (PROTEin complement expressed by a genOMEor by a cell or tissue type). (Wilkins et al., 1995 Biotechnology and Genetic Engineering Reviews 13, 19-50.)
Definition of Proteomics • Yates defined proteomics as the scientific discipline of characterizing and analyzing the proteins, protein interactions, and protein modifications of an organism. • Gygi and Aebersold defined proteomics as the ability to systematically identify every protein expressed in a cell or tissue tissue as well as to determine the salient properties of each protein, i.e., abundance, state of modification, involvement in multiprotein complexes, etc. • Wagner defined the proteome is the entire profile of all the proteins expressed by a cell or a tissue under strictly defined conditions at a given time. -proteomics aims to: -separate identity and characterize proteins on a large scale -define levels of proteins in cells / tissues and how these change -investigate protein complexes -elucidate protein functions, pathways, and interrelationships
Genome Transcriptome Proteome DNA RNA Proteins Modified Proteins Y Biological Function Y Transcription Translation Post-Translation Modification x 5 to 50 functional links per protein > 1,000,000 Proteins <30,000 Genes Why the study of proteins is so challenging?
A polypeptide can fold to generate a particular three-dimensional structure specified by its amino acid sequence. The structural description of proteins is described in terms of four levels of organization.
MS-based Proteomics • Quantitative • Protein quantitation • ICAT • iTRAQ • SILAC • O16/O18 • Non-labelling tech. • MRM • Qualitative • Protein identification • Peptide Mass Fingerprint (PMF) • MS/MS ion searching • De novo Sequencing • Post Translation Modification (PTM)
Modification Methylation Several mRNA level expressed protein level The general Property Differences between DNA and Protein
Goal of Genomics and Proteomics • What do biologists want? • Identify proteinssequence of primary structure and look up genomic and protein database • Characterize proteinsanalyze biologically relevant modifications • Look for differetially-expressed proteins as biomarkers • Look for protein complexes and networksbiological function(new drug!)
Separation based on pI Separation based on size Analyze spots by AAA Sequencing Mass spectrometry Conventional Approach Protein Extract Separate proteins on 2-D gels
1183.6498 1199.6755 1457.6913 1552.7802 1894.9346 1488.7815 1909.9414 1485.7244 1876.9218 1045.5584 1675.7370 2299.1675 1430.7831 2167.1922 2599.2658 1000 1500 2000 2500 Mass (m/z) Protein ID : Experimental Approach Extract peptides; MALDI-TOF analyze or qQ-TOF analyze Run 2D gel; Stain/Image Edman Degradation AAA Composition Immunoblot MS Excise spot; wash; digest Database search
Protein Proteolytic Peptides Fragment Mass Spectrum M/Z Protein Sequence Theoretical Proteolytic Peptides Theoretical Fragment Mass Spectrum GLSDGEWQLVLNVWGK VEADIPGHGQEVLIR LFKGHPETLEK FDKFKHLK SEDEMK ASEDLK ... GLSDGEWQLVLNVWGKVEADIPGHG QEVLIRLFKGHPETLEKFDKFKHLK SEDEMKASEDLKKHGATVLTALGGI LKKKGHHEAEIKPLAQSHATKHKIP VKYLEFISECIIQVLQSKHPGDFGA DAQGAMNKALELFRKDMASNYKELG FQG M/Z Peptide-Mass Fingerprinting (PMF)
Advantages & Disadvantages of 2D gel Approach • Excellent resolving power • Visual display of protein patterns • Well established technique and Relatively inexpensive to get started with manual techniques • Poor ability to handle certain classes of proteins • membrane, basic, acidic, high and low molecular weight proteins • Multiple spots correspond to the same protein or multiple protein products co-migrate to the same spot • Cannot visualize low abundant proteins; Only abundance proteins are identified • Time consuming and difficult to automate • Limited recovery of analyte for further analysis • Poor reproducibility; limited dynamic range; certain protein stain poorly or not at all. • 2-D gel does not possess the sensitivity and the dynamic range needed for isolating different proteins
Limitation of 2-D Gel Based Proteomics Platform • Mouse liver protein database by F. Hoffmann-La Roche Pharmaceutical Research published in Electrophoresis, 2001 showed that analysis of approximately 5800 spots excised from 14 2-D gels resulted in the id of 2,500 proteins which are the products of 328 genes. • Likewise, in a study published in 2002, only 278 genes whose protein products were identified from rat liver.
Protein Detection Methods • Coomassie Blue 0.1 mg/band - 1 mg/band • Fluorescent Stain 1 - 10 ng/band • Silver Stain 1 - 10 ng/band • 1 ng of a 10kDa 100 femtomoles • 1 ng of a 100kDa 10 femtomoles
HPLC LC/MS Impurity 2, 3 A compound Impurity 1 Packing Material Elution Sample High-Performance Liquid Chromatography Loading Sample
Multi Dimensional Liquid Chromatography • Size – Gel filtration columns • Affinity • Charge – Ion exchange columns • Hydrophobicity – HIC columns, Reverse phase
Larger Protein UV absorbance Smaller Protein V0 Vi Vt Size Exclusion • Separation of proteins based on their size: The beads are composed of dextran polymers (sephadex), agarose (Sepharose), polyacrylamide (Sephacryl or BioGel P). Each bead contains pores of approximate macromolecule sizes. Larger molecules will travel through less pores, thus migrate faster. Smaller molecules will travel through more pores, thus migrate slower. The molecules passively distribute between the volume outside the porous beads (V0) and the volume inside the beads (Vi) dependent on their ability to enter the pores. If the total volume of the column is Vt, Vt = Vo + Vi Reference:清華大學 分子與細胞生物研究所暨生命科學系張大慈教授
UV absorbance Affinity Chromatography Affinity chromatography makes use of the affinity between a ligand and the protein of interests. Ligands are usually immobilized through covalent bonds on insoluble matrix, such as cellulose or polyacrylamide. The protein of interests become bound to the matrix while other proteins flow through the column. After washing the protein bound to the matrix can be eluted by adding completing groups such as the free ligand, or reagents that disrupt the interactions. Examples of ligand-protein interactions include those between antibodies and antigens, those between Ni+ and poly-histidine tag. Free ligand concentration