Download
1 / 40
400 likes | 620 Views
Unit 1 Introduction to Statistics. Math 3 Ms. C. Taylor. Warm-Up. How do I find the mean and median of a data set?. Introduction to Statistics. How do I understand statistics as a process for making inferences about population parameters based on a random sample from that population?

E N D
Unit 1 Introduction to Statistics Math 3 Ms. C. Taylor
Warm-Up • How do I find the mean and median of a data set?
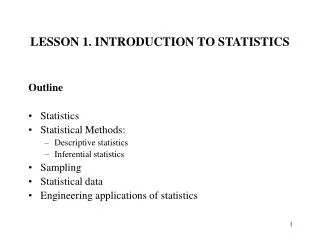
Introduction to Statistics • How do I understand statistics as a process for making inferences about population parameters based on a random sample from that population? • How do I recognize the purposes of and difference among statistical data gathering methods?
What is/are statistics? • Statistics is a way of reasoning, along with a collection of tools and methods, designed to help us understand the world. • Statistics are particular calculations made from data
Population Data or Sample Data? • Population data is used when you are gathering data from every individual of interest. • Ex: Asking the entire football team a question • Sample data is used when you are gathering data from some of the individuals of interest. • Ex: Asking only the offensive line a question and apply it to the entire football team
Population Data or Sample Data? • You want to know the average GPA of North Forsyth students, so you ask all of the students in all of your classes. • Population • Sample
Parameter vs. Statistic • A statistic is a descriptive measure computed from a sample of data. • A parameter is a descriptive measure computed from an entire population of data. • Inferential statistics enables you to make an educated guess about a population parameter based on a statistic computed from a sample randomly drawn from that population.
Correlation vs. Causation • Correlation: The degree to which two or more measurements on the same group of elements show a tendency to vary together. • Causation: The degree to which one causes the other to happen. • Correlation does not imply causation • Example: There is correlation between the number of people wearing shorts and temperature. More people wearing shorts doesn’t cause higher temperatures!
Ways to Gather Data • Survey – a questionnaire used to collect interesting data on a certain topic from a sample of people. • EX: You want to find out how many students in your class had a summer job. • EX: The government wants to determine average household income in the United States. • EX: You want to know if tattoos have an influence on a person’s GPA.
Ways to Gather Data • Observational Study – we observe individuals and measure variables of interest but do not attempt to influence the responses. Observational Studies may show a correlation between variables, but cannot always guarantee causation. • EX: A study of child care enrolled 1364 infants in 1991 and planned to follow them through their sixth year in school. In 2003, the researchers published an article finding that “the more time children spent in child care from birth to age four-and-a-half, the more adults tended to rate them, both at age four-and-a-half and at kindergarten, as less likely to get along with others, as more assertive, as disobedient, and as aggressive.”
Ways to Gather Data • Experiment – we deliberately impose some treatment on (that is, do something to) individuals in order to observe their responses. Experiments can carry more convincing evidence of a cause and effect relationship. • EX: “Take the Pepsi Challenge” – in the 80’s Pepsi had a huge marketing scheme that had people do a blind taste test to see which soda they preferred – Pepsi or Coke. • EX: Does Vitamin C reduce the causes of getting a common cold?
Warm-Up • Determine if the following is a survey, experiment, or observational study. • Students are asked about their favorite music. • Walking in a classroom to see if technology is efficiently used. • Deciding if Claritin or Allegra is the best allergy medicine.
Sampling • When conducting a survey, experiment, or observational study, it is almost impossible to survey everyone in a population so people use various sampling methods to gather information. • One major concern about sampling methods is whether it is a biased or unbiased method to gather information.
Sampling Methods • Random sampling: when everyone in a population has an equal chance of being chosen in the experiment. • Stratified sampling: when the population is first divided into similar categories and the number of members in each category is determined. • Systematic sampling: when you determine a method for which to choose members of the population (assign numbers to the population and then choose every 5th person to participate) • Cluster sampling: when you randomly put the population into clusters and then choose a cluster randomly and then randomly choose people in that cluster to participate.
Example if selecting 10 animals from 25 dogs, 15 cats, and 10 rabbits • Random sampling: when everyone in a population has an equal chance of being chosen in the experiment. Randomly selecting 10 from all 50 animals • Stratified sampling: when the population is first divided into similar categories and the number of members in each category is determined. Select 5 from 25 dogs, 3 from 15 cats and 2 from the rabbits • Systematic sampling: when you determine a method for which to choose members of the population (assign numbers to the population and then choose every 5th person to participate) Give every animal a random number and then choose every 5th number • Cluster sampling: when you randomly put the population into clusters and then choose a cluster randomly and then randomly choose people in that cluster to participate. Randomly put the animals into 2 groups of 25, choose a group, and then choose 10 from that selected group.
Biased Questions • Some questions may use language that people can associate with emotions: • How much of your time do you waste on Facebook? • Do you prefer the wonderful math class or boring Shakespeare Class? • Some questions may refer to a majority or supposed authority: • Would you agree with the NCAE that teachers should be paid more for earning their master’s degree? • Phrased awkwardly: • Do you disagree with people who oppose the ban on smoking in public places?
Sampling Bias • Occurs when one or more sub groups of a population are either over represented or under represented when conducting a survey or experiment. It must be random and fair selection • Voluntary: People voluntarily turn in a survey • Convenience: Questioner stays in one place • Exclusion: Only asking certain members • Under representation: Not getting 1/6 or at least 30 people • Non-randomness: Calling the first five people on every page of the phonebook. • Self-selection: People choose groups • Lack of double-blinding: Sampler knows which group/product the person is selecting
Errors in Summarizing Data • No causation of effect: The cause could be affected by something other than what is being studied. (correlation only) • (Ex: Frog with no legs are deaf) • No causation of accurate population: Applying your results to the population incorrectly. • (Ex: Just because 85% of this class like math, it doesn’t mean that 85% of all students at this school like math.) • www.tylervigen.com shows correlations no causations
Resources used: • "Next: Introduction to Data and Measurement Issues Surveys and Samples." CK-12 Foundation. N.p., n.d. Web. 21 Aug. 2013. • Yates, Daniel S., David S. Moore, and Daren S. Starnes. The Practice of Statistics: TI-83/84/89 Graphing Calculator Enhanced. New York: W.H. Freeman, 2008. Print. • Greg Fisher – Mount Tabor High School • Christina Holst – Parkland High School • Wendy Bartlett – Parkland High School
Warm-Up • What percentage of the data lie within one standard deviation of the mean? • What percentage of the data lie within two standard deviations of the mean? • What percentage of the data lie within three standard deviations of the mean?
Standard Deviation • First, find the mean (average) of the data set • The way to get the variance is to subtract the mean from EACH value • Square the each of step 2’s results • Find the mean of the squared results (variance) • Take the square root of the variance
Warm-Up • What is the standard deviation for the set of data? 2, 4, 3, 6, 5
Probability • Denoted by P(Event) P(E) = favorable outcomes total outcomes • This method for calculating probabilities is only appropriate when the outcomes of the sample space are equally likely.
Experimental Probability • The relative frequency at which a chance experiment occurs • Flip a fair coin 30 times & get 17 heads i.e. 17/30
Basic Rules of Probability • Rule 1.Legitimate Values For any event E, 0 < P(E) <1 • Rule 2.Sample space If S is the sample space, P(S) = 1
Rules Continued • Rule 3.Complement For any event E, P(E) + P(not E) = 1 • Rule 4.Addition If two events E & F are disjoint, P(E or F) = P(E) + P(F) (General) If two events E & F are not disjoint, P(E or F) = P(E) + P(F) – P(E & F)
Example #1 • A large auto center sells cars made by many different manufacturers. Three of these are Honda, Nissan, and Toyota. (Note: these are not simple events since there are many types of each brand.) Suppose that P(H) = .25, P(N) = .18, P(T) = .14. • Are these disjoint events? yes • P(H or N or T) = • P(not (H or N or T) =
Example #2 • Musical styles other than rock and pop are becoming more popular. A survey of college students finds that the probability they like country music is .40. The probability that they liked jazz is .30 and that they liked both is .10. What is the probability that they like country or jazz? • P(C or J) =
Independent • Two events are independent if knowing that one will occur (or has occurred) does not change the probability that the other occurs • A randomly selected student is female - What is the probability she plays soccer for PWSH? • Independent • A randomly selected student is female - What is the probability she plays football for PWSH? • Not Independent
Rules Continued • Rule 5.Multiplication If two events A & B are independent, • General rule:
Example #3 • A certain brand of light bulbs are defective five percent of the time. You randomly pick a package of two such bulbs off the shelf of a store. What is the probability that both bulbs are defective? • Can you assume they are independent? P(D & D)=
Conditional Probability • A probability that takes into account a given condition P P
Example #4 • In a recent study it was found that the probability that a randomly selected student is a girl is .51 and is a girl and plays sports is .10. If the student is female, what is the probability that she plays sports? • P
Warm-Up • What is the probability of the following events? • Probability that I roll a 4. • Probability that I get a heads. • Probability that I roll a 1.
Probability • Probabilities are written as: • Fractions from 0 to 1 • Decimals from 0 to 1 • Percents from 0% to 100%
Probability If an event is certain to happen, then the probability of the event is 1 or 100%. If an event will NEVER happen, then the probability of the event is 0 or 0%. If an event is just as likely to happen as to not happen, then the probability of the event is ½, 0.5 or 50%.
Probability Impossible Unlikely Equal Chances Likely Certain 0 0.5 1 0% 50% 100% ½
Fundamental Counting Principle • The fundamental counting principle says that the number of possible combinations is the product of the items multiplied together. • Example: Ms. Taylor has 12 shirts, 5 pairs of jeans, and 6 pairs of shoes to choose from, how many outfits are possible? • 12 * 5 * 6 = 360 outfits
Permutations • Order DOES matter! • Example: I have 245 students that competed in a mathematics game. There is a first, second, and third place winner, how many ways can I choose the winners?
Combinations • Order DOESN’T matter! • Joe has 54 species of animals and he wants to pick 5 different ones, how many combinations are possible?