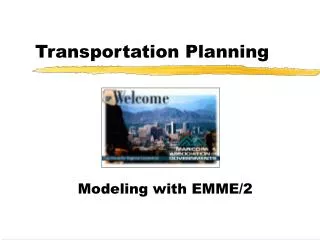
Transportation Planning
Explore the intricacies of transportation planning and modeling using EMME/2 through the MAG Model in Maricopa County. This comprehensive document covers agency interconnections, methodologies for traffic demand forecasting, and updates to the regional transportation model. Analyzing diverse factors such as socioeconomic variables, trip purposes, and network service levels, it provides insights into transportation dynamics across major municipalities like Phoenix, Tempe, and Scottsdale. Major updates from foundational studies dating back to 1979 shape the evolution of the transportation framework in this populous region.

Transportation Planning
E N D
Presentation Transcript
Transportation Planning Modeling with EMME/2
Agencies Running The MAG Model • Maricopa County • Regional Public Transportation Authority • Scottsdale • Tempe
Agencies Supported • Buckeye • Chandler • Fountain Hills • Phoenix • ADOT • Gila River Indian Community • Gilbert • Glendale • Goodyear • Mesa • Pima Association of governments • Peoria • Phoenix • Pima-Maricopa Indian Community • US HUD
Components • Transportation Model • Land Use • Highway Network • Transit Network • Documentation
Major Updates • 1984 Travel Demand Model (UTPS) • 1979 Travel Speed Study • 1980 On-Board Bus Survey • 1981 Home Interview Survey • 1990 Travel Model Update (UTPS) • 1986 On-Board Bus Survey • 1986 Travel Speed Study • 1989 Home Interview Survey • 1995 Conversion to EMME2 and Model Update • 1989 Home Interview • 1991 On-Board Bus Survey • 1993 Travel Speed Study
Recent Improvements • Feedback to Trip Distribution • HOV Modeling • Graphics • Model Flexibility • Remote Access
Socioeconomic Variables • Residential • Location • Household Income • Auto Ownership • Employment • Location • Type
Modeled Area • Area is 60 x90 miles • 29 Member Agencies • 1541 Transportation Analysis Zones
Modeled Area • Area is 60 x90 miles • 29 Member Agencies • 1541 Transportation Analysis Zones
Trip Purpose Stratification • Home-Based Work • Income Group Stratification • Home-Based Shopping • Home-Based Other • Home-Based School • Elementary/Secondary • Arizona State University • Other University • Non-Home Based • Non-Home-Based Other • Non-Home-Based Work
Trip Generation • Trip Production • j = f (Household size j, Household income j) • Trip Attraction • j = f (Retail Employment j, other employment j, households j)
Network Level of Service • Highway • Travel distance ij • Travel time ij • Travel Cost • Transit • Walk time ij • First wait ij • In-vehicle time ij • Transfer time ij • Fare ij • Number of transfers • Drive access areas • Walk access areas
Trip Distribution Pi(Aj x Fij) S (Aj x Fij) Tij = Tij = Trips from Zone i to Zone j Aj = trip Attraction in Zone j Pi = Trip Production in Zone i Fij =Effect of travel time & distance between Zone i & Zone j
AM Peak Period Bus Travel Time Factor AM PEAK PERIOD
Multinomial Logit Structure Choice Transit Walk Transit Drive Drive Alone Shared Ride Access Access 2 Occupants 3 Occupants 4+ Occupants
Mode Choice Pij = Probability of using transit for a trip between Zone i to Zone j Transit untilityij = f (transit level of serviceij , incomei ) Auto utilityij = f (highway level of service ij , income ij
Home Based Work Observed vs. Estimated Trips by Mode
Home Based Non-Work Observed vs. Estimated Trips by Mode
Non-home Based Observed vs. Estimated Trips by Mode
Transit Trips Thousands
Transit Boardings Thousands
1980 Weekday 24-hour Counts I-10: East of 40th Street
Highway Travel Forecasting Accuracy of Models in Phoenix and Other Planning Areas