Download

1 / 32
320 likes | 546 Views
Potential role of PPAR activation in CV risk reduction. Genetic background. Food intake excess. Physical inactivity. Obesity. Hyperglycemia. Hyperinsulinemia. Insulin. Dyslipidemia. Inflammation. PPAR modulation. Hypercoagulation. Hypertension. resistance. Atherosclerosis.

E N D
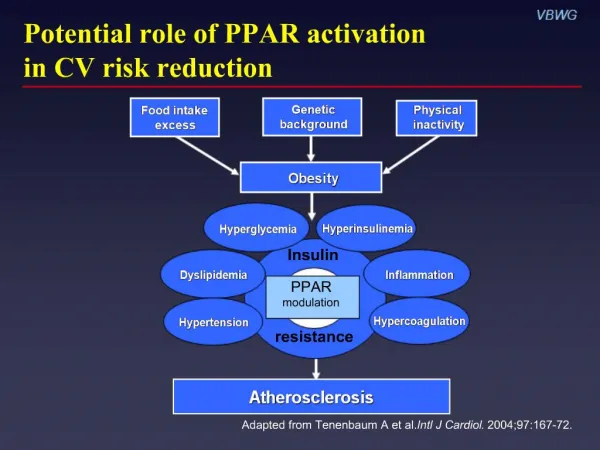
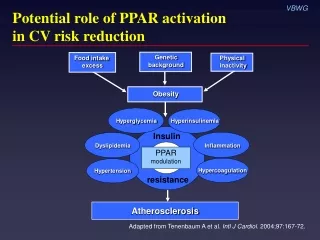
Potential role of PPAR activation in CV risk reduction Geneticbackground Food intake excess Physical inactivity Obesity Hyperglycemia Hyperinsulinemia Insulin Dyslipidemia Inflammation PPAR modulation Hypercoagulation Hypertension resistance Atherosclerosis Adapted from Tenenbaum A et al. Intl J Cardiol. 2004;97:167-72.
Peroxisome proliferator-activator receptors (PPARs): Overview • Family of steroid hormone nuclear receptors • Three isotypes identified • PPAR • PPAR • PPAR • Ligand-activated transcription factors regulatingmetabolic processes Plutzky J. Science. 2003;302:406-7.
PPAR activation and atherosclerosis: A hypothesis Ligandendogenous or synthetic Activated PPAR receptor DirectVascular and inflammatory cells IndirectFat, liver, skeletal muscle Cytokines Chemokines Cholesterol efflux Adhesion molecules FFA Glucose Insulin sensitivity Triglycerides HDL Reducesinflammation ? ? ? ? Blunts atherosclerosis Adapted from Plutzky J. Science. 2003;302:406-7.
Focus on PPAR activation • Reduces insulin resistance • Preserves pancreatic -cell function • Improves CV risk profile Improves dyslipidemia ( HDL, LDL density, or TG) Renal microalbumin excretion Blood pressure VSMC proliferation/migration in arterial wall PAI-1 levels C-reactive protein levels Adiponectin Free fatty acids Inzucchi SE. JAMA. 2002;287:360-72.
PPAR modulators Name Trade name Manufacturer Approval status Troglitazone Rezulin Parke-Davis 1997* Rosiglitazone† Avandia GlaxoSmithKline 1999 Pioglitazone‡ Actos Eli Lilly/ 1999 Takeda Pharmaceuticals Muraglitazar§ Pargluva Bristol-Myers Squibb/ NDA Merck submitted 2004 *Withdrawn March 2000 †Also available in combination with metformin or sulfonylurea ‡ Also available in combination with metformin§Dual PPAR/ agonist
PPAR modulation: Newest strategy in CV risk reduction Hyperinsulinemia Hyperglycemia Insulin Dyslipidemia Inflammation PPAR modulation Hypercoagulation Hypertension resistance Adapted from Tenenbaum A et al. Intl J Cardiol. 2004;97:167-72.
Factors that may drive the progressive decline of -cell function Insulinresistance Hyperglycemia (glucose toxicity) -cell “Lipotoxicity” (elevated FFA, TG) Adapted from Kahn SE. J Clin Endocrinol Metab. 2001;86:4047-58. Adapted from Ludwig DS. JAMA. 2002;287:2414-23.
TRIPOD: Evidence that insulin resistance causes -cell failure N = 266 Hispanic women with gestational diabetes randomized to troglitazone 400 mg or placebo for median 30 months • PPAR activation: 55% relative risk reduction for new-onset diabetes (HR 0.45; 0.25–0.83) • Effect was most prominent in women with initial increase in insulin sensitivity and accompanying large reduction in insulin output • Protection persisted 8 months after cessation of active treatment • PPAR activation associated with preserved -cell function TRIPOD = Troglitazone in Prevention of Diabetes Buchanan TA et al. Diabetes. 2002;51:2796-803.
DPP: Improving insulin sensitivity/secretion prevents diabetes 30 Placebo Metformin Lifestyle Insulinsecretion(IGR) 25 20 Low Medium 15 High 10 5 Insulinsecretion(IGR) 0 High Low Medium Low Medium High Low Medium High Insulin sensitivity (1/fasting insulin) N = 3234 Diabetes hazard rate (per 100 pyr) pyr = person years IGR = insulin-to-glucose ratio DPP = Diabetes Prevention Program DPP Research Group. Diabetes. 2005;54:2404-14.
PPAR activation blunts progression to diabetes Diabetes Prevention Program 15 Placebo Metformin 850 mg 10 Cumulative incidence (%) Lifestyle Troglitazone400 mg* 75% vs placeboP < 0.001 5 0 0.0 0.5 1.0 1.5 Years n = 2343 1568 237 739 DPP Research Group. Diabetes. 2005;54:1150-6. *Terminated early after 1.5 years
PPAR activation improves -cell function N = 17 with type 2 diabetes 5 P = 0.02 4 3 Disposition index 2 1 0 Rosiglitazone 8 mg Insulin –1 Acute insulin response to glucose (µIU/mL/10 min) Disposition index = HOMA-IR HOMA-IR = Homeostasis model assessment of insulin resistance Ovalle F, Bell DSH. Diabetes Care. 2004;27:2585-9.
CV implications of insulin resistance and PPAR activation Hyperglycemia Hyperinsulinemia Insulin Dyslipidemia Dyslipidemia Inflammation PPAR modulation Hypercoagulation Hypertension resistance Adapted from Tenenbaum A et al. Intl J Cardiol. 2004;97:167-72.
Importance of LDL particle density • In insulin resistance, LDL-C levels are similar or only slightly elevated vs general population • However, atherogenicity of LDL particles varies according to density – More dense = more atherogenic • Proportion of small, dense LDL particles greater in patients with insulin resistance or diabetes vs general population Miranda PJ et al. Am Heart J. 2005;149:33-45.
Greater atherogenicity of small, dense LDL vs normal LDL Susceptible to oxidation Binds to arterial wallPenetrates arterial wall Toxic to endothelial cells Promotes PAI-1 production by endothelial cellsPromotes thromboxane production by endothelial cellsAccumulates Ca2+ in vascular smooth muscle cellsBinds to LDL scavenger receptor Adapted from Sniderman AD et al. Ann Intern Med. 2001;135:447-59.
Increased small, dense, LDL particles associated with reduced IHD survival N = 2072 men without IHD at baseline;13-year follow-up 1.00 Survivalprobabilities 0.90 P < 0.001 0.80 0 2 4 6 8 10 12 Follow-up (years) Tertiles of LDL-C255Å 1.07–1.86 mmol/l ≥1.86 mmol/l <1.07 mmol/l St-Pierre AC et al. Arterioscler Thromb Vasc Biol. 2005;25:553-9. IHD = ischemic heart disease
PPAR activation increases LDL size and buoyancy N = 302; rosiglitazone 8 mg LDL density LDL particle size 0.04 8 P < 0.0001 P < 0.0001 Relativeflotationvs baseline Diametervs baseline(Angstroms) 4.8 0.019 4 0.02 0 0 Brunzell JD et al. Circulation. 2004;110(suppl):III-143.
Comparative effects of PPAR activators on lipids in diabetes • In patients not receiving statin therapy, studies suggest that pioglitazone and rosiglitazone have differing effects on lipid levels and particle size1 • In patients receiving statin therapy, some studies suggest these differences are eliminated, while other studies suggest they persist2 • Clinical implications are not known3 1Goldberg RB et al. Diabetes Care. 2005;28:1547-54. 2Plotkin DJ et al. Diabetes. 2005;54(suppl 1):A232. 3Khan M et al. Diabetes. 2005;54(suppl 1):A137.
CV implications of insulin resistance and PPAR activation Hyperglycemia Hyperinsulinemia Insulin Inflammation Inflammation Dyslipidemia PPAR modulation Hypertension Hypercoagulation resistance Adapted from Tenenbaum A et al. Intl J Cardiol. 2004;97:167-72.
Adipokines: An overview CRP IL-6 PAI-1 Angiotensinogen Leptin Resistin MCP-1 Adiponectin Antiatherogenic Atherogenic Lau DCW et al. Am J Physiol Heart Circ Physiol. 2005;288:H2031-41. Wellen KE, Hotamisligil GS. J Clin Invest. 2005;115:1111-9.
Adiponectin associated with decreased risk of MI N = 18,225 men; 6-year follow-up 1.2 1.0 0.8 Relative 0.6 risk 0.4 0.2 0.0 1 2 3 4 5 Quintile of adiponectin (95% CI) g/mL 7.9 12.6 16.5 21.1 29.2 m Adjusted relative risk (P < 0.001) Lipid-adjusted relative risk (P < 0.02) Pischon T et al. JAMA . 2004;291:1730-7.
Improved insulin sensitivity associated with increased adiponectin N = 40 women with gestational diabetes treated with troglitazone for 3 months 500 400 % Change in insulin sensitivity (Si) 300 200 100 –50 –25 25 50 75 100 –100 % Change in HMW/total adiponectin (SA) Pajvani UB et al. J Biol Chem. 2004;279:12152-62.
Contrasting roles of CRP and PPAR on inflammation and insulin resistance Adipose tissue IL-6 Liver CRP PPAR Glucose Insulinresistance Lau DCW et al. Am J Physiol Heart Circ Physiol. 2005;288:H2031-41.
Direct relationship of CRP to metabolic syndrome Women’s Health Study; N = 14,719 8 6 Median CRP(mg/L) 4 2 0 0 1 2 3 4 5 Components of the metabolic syndrome (n) n = 4086 3884 3152 2292 1135 170 Ridker PM et al. Circulation. 2003;107:391-7. Modified ATP III definition
Inflammation is a contributing mechanism in diabetes development N = 1047 25 20 P = 0.06 P = 0.001 P = 0.001 Incidence(%) 15 10 5 0 Fibrinogen CRP PAI-1 Quartiles of inflammatory proteins 1st 2nd 4th 3rd Festa A et al. Diabetes. 2002;51:1131-7.
PPAR activation decreases CRP in patients with diabetes N = 357; 26 weeks Rosiglitazone 4 mg Rosiglitazone 8 mg Placebo 0 –10 Mean change from baseline(%) –20 –30 –40 P < 0.05 –50 27% P < 0.05 22% Haffner SM et al. Circulation. 2002;106:679-84.
CV implications of insulin resistance and PPAR activation Hyperglycemia Hyperinsulinemia Insulin Dyslipidemia Inflammation PPAR modulation Hypercoagulation Hypertension Hypertension resistance Adapted from Tenenbaum A et al. Intl J Cardiol. 2004;97:167-72.
Improved insulin sensitivity associated with reduced BP VBWG N = 24 nondiabetic hypertensives; rosiglitazone 8 mg, 16 weeks 20 10 in 24-h systolic BP(mm Hg) 0 –10 –20 –2 –1 0 1 2 3 Change in insulin sensitivity (mg/kg/min) Low-renin hypertension Nonmodulators P < 0.005r = –0.59 Raji A et al. Diabetes Care. 2003;26:172-8.
PPAR activation associated with sustained BP reduction N = 668 with type 2 diabetes Rosiglitazone added to baseline therapy Baseline metformin 6 months 12 months Baseline sulfonylurea 6 months 12 months –6 –5 –4 –3 –2 –1 0 1 –5 –4 –3 –2 –1 0 1 24-h diastolic BP*Treatment differences (mm Hg, 95% CI) 24-h systolic BP*Reduction from baseline (mm Hg, 95% CI) *Ambulatory BP Home PD et al. Diabetes. 2005;54(suppl 1):A134.
CV implications of insulin resistance and PPAR activation Hyperglycemia Hyperinsulinemia Insulin Dyslipidemia Inflammation PPAR modulation Hypercoagulation Hypertension resistance Adapted from Tenenbaum A et al. Intl J Cardiol. 2004;97:167-72.
PPAR activation blunts TNF-–induced PAI-1 secretion Human umbilical-vein endothelial cells 800 600 PAI-1 (ng) 400 † 200 * * 0 TNF-1 ng/mL+Trog 10 µM TNF-10 ng/mL TNF- 10 ng/mL +Trog 10 µM TNF-100 ng/mL TNF-1 ng/mL TNF- 100 ng/mL +Trog 10 µM Trog = troglitazone *P < 0.001 †P < 0.005 Hamaguchi E et al. J Pharmacol Exp Ther. 2003;307:987-94.
Metformin reduces PAI-1 levels in type 2 diabetes N = 27, 12 weeks 35 30 25 20 15 10 5 0 PAI-1 activity(U/mL) * Basal Placebo Metformin 2.5 g Results at 12 weeks A1C= –1.3% FPG = –55 mg/dL Nagi DK, Yudkin JS. Diabetes Care. 1993;16:621-9. * P = 0.001 vs placebo
Benefits of combined insulin sensitizer therapy: Effects on CRP, PAl-1, and MMP-9 Weeks 8–24 MMP-9 30 * 22.2 20 10 Baseline(%) CRP PAl-1 0 –0.56 –10 –9.8 –14.35 * –20 P = 0.046 –30 –26.9 –32.76 P = 0.026 –40 P < 0.001 Metformin 2 g (n = 70) Metformin 1 g + rosiglitazone 8 mg (n = 57) Weissman PN et al. Diabetes. 2004;53(suppl 2):A28. *NS vs baseline