
해상풍력 설비용량 전망
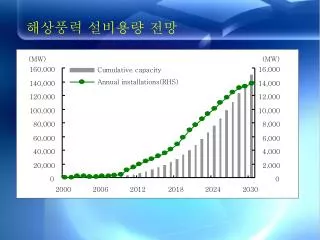
해상풍력 설비용량 전망. (MW). (MW). 160,000. 16,000. Cumulative capacity. Annual installations(RHS). 140,000. 14,000. 120,000. 12,000. 100,000. 10,000. 80,000. 8,000. 60,000. 6,000. 40,000. 4,000. 20,000. 2,000. 0. 0. 2000. 2006. 2012. 2018. 2024. 2030. 해상풍력 투자금액과 이산화탄소 저감량 전망.

해상풍력 설비용량 전망
E N D
Presentation Transcript
해상풍력 설비용량 전망 (MW) (MW) 160,000 16,000 Cumulative capacity Annual installations(RHS) 140,000 14,000 120,000 12,000 100,000 10,000 80,000 8,000 60,000 6,000 40,000 4,000 20,000 2,000 0 0 2000 2006 2012 2018 2024 2030
해상풍력 투자금액과 이산화탄소 저감량 전망 (£billion) (Mt) 18 350 Annual offshore investments 16 CO₂avoided annuall(RHS) 300 14 250 12 200 10 8 150 6 100 4 50 2 0 0 2000 2006 2012 2018 2024 2030
해상풍력발전 관련주 자료: 대신증권 리서치센터
해상풍력발전 관련주 자료: 대신증권 리서치센터
해상풍력발전 관련주 자료: 대신증권 리서치센터
해상풍력발전 관련주 자료: 대신증권 리서치센터
해상풍력발전 관련주 자료: 대신증권 리서치센터