Download
1 / 32
330 likes | 544 Views
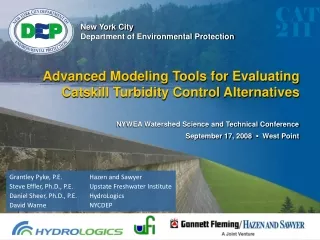
New York City Department of Environmental Protection. Advanced Modeling Tools for Evaluating Catskill Turbidity Control Alternatives. NYWEA Watershed Science and Technical Conference September 17, 2008 ▪ West Point.

E N D
New York City Department of Environmental Protection Advanced Modeling Tools for EvaluatingCatskill Turbidity Control Alternatives NYWEA Watershed Science and Technical Conference September 17, 2008 ▪ West Point Grantley Pyke, P.E. Hazen and SawyerSteve Effler, Ph.D., P.E. Upstate Freshwater Institute Daniel Sheer, Ph.D., P.E. HydroLogics David Warne NYCDEP
Outline I. Study Overview -Issue & Objectives -Alternatives Evaluated II. Reservoir Modeling Framework -Reservoir Water Quality Models -Reservoir System Operations Model III. Evaluation of Alternatives -Water Quality Performance IV. Conclusions
Issue: Major storm events in the Schoharie & Ashokan watersheds lead to periodic elevated turbidity levels in the Catskill system Overall Study Goal: Evaluate turbidity control alternatives at Ashokan that can:a) reduce the frequency of high turbidity levels entering Kensico, and b) reduce the need for alum treatment at Kensico Why Interesting? Demonstrates how models are critical for sound decision-making in complex systems Catskill Turbidity Control Study
4 Esopus Creek Flow and Alum Treatment Events 46 BG in 11 days 46 BG in 12 days 44 BG in 13 days
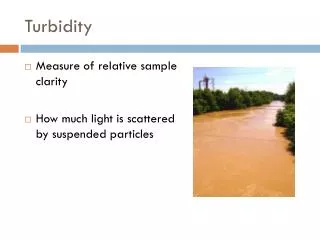
Catskill Turbidity Sources Streambank and streambed erosion • Watershed underlain by glacial lake silts and clays • Minimally armored streams • Small particles scatter light efficiently Photo Courtesy NYCDEP
Alt. 3: E Basin Diversion Wall: To reduce short-circuiting into Upper Gate Chamber Alt. 5: New East Basin Intake: To withdraw from a location less susceptible to high turbidity Alt. 2: Dividing Weir Crest Gates: To increase W Basin detention storage ~$330M ~$140M ~$130M Alt. 1: West Basin Outlet Structure: To release water from the W Basin and reduce turbidity load into the E Basin ~$65M Alt. 4: Upper Gate Chamber Modifications: To improve selective withdrawal capability Alt. 6: Catskill Aqueduct Improvements and Modified Operations: a) West Basin Drawdown b) Waste Channel Operation c) Catskill Aqueduct Improvements ~$90M ~$250M Ashokan Reservoir Turbidity Control Alternatives
Performance Evaluation Approach • How will an alternative improve Catskill turbidity control under the full range of conditions that the system will experience? Water Quality • Depends on forcing conditions • Depends how reservoirs and aqueducts are operated (feedback effects) • Extent of drawdown • Timing of diversions & releases • Reservoir balancing Operations • Depends on water quality • Depends on Catskill conditions • Ashokan storage, Esopus flow • Depends on system conditions • seasonal demands, storage levels, drought status Water Quality from Schoharie & Ashokan 2-D Models Operations from Reservoir System Model (OASIS)
Developed by UFI using CE-QUAL-W2 frameworkModel development & testing supported by: Continuous Automated Monitoring Continuous automated in-stream and in-reservoir monitoring Detailed Daily Depth Profiles Temperature, Specific Conductance, Beam Attenuation Coefficient, Optical Backscatter Process Studies Particle Settling Velocity Sediment Resuspension Downward Sediment Flux Internal Wave Characterization Wave Pressure Measurements Storm Event Gridding/Profiling Detailed vertical profiles of reservoir water quality collected during and after storm events Lateral and longitudinal transects Sensitivity Analysis Robust analysis of sensitivity of Ashokan model predictions to model drivers and model parameters Schoharie, Ashokan, and Kensico Reservoir Water Quality Models (W2)
OASIS Model ofNew York City Water Supply System and Delaware River Basin OASIS Model • Mass-balance reservoir system operations model • Developed by HydroLogics • Simulates operation of the reservoir system using goals, constraints, and linear programming • Makes decisions every day about how much water to release from each reservoir in order to meet demands and environmental requirements
Physical Data Storage – Elevation curves Spillway rating curves Head-discharge functions for tunnels/aqueducts Reservoir storage zones Operating Rules Stream releases Reservoir balancing Operating preferences Operating Rules coded into Operations Control Language: OASISSystem Model
Model includes net daily inflow to each reservoir and stream reach for the period 1948 - 2004 Objective is NOT to model history and recreate what happened Objective is to use historical inflows as an indicator of the range of inflows that could occur in the future OASIS Modeling Approach: Historical Inflows combined with System Scenarios • Historical Inflows • Daily, for each stream reach and reservoir • Represents range of future inflows • System Scenario • Demand • Regulations • Infrastructure • Operating Rules • Performance • Water Supply • Water Quality x
OASIS-W2 Linked Model OASIS Model of NYC Reservoir System & Delaware River Basin Schoharie W2 • Daily Simulation:1948 – 2004 (57 yrs) • Daily Turbidity Predictions at Schoharie-Ashokan-Kensico • Daily Release and Diversion Decisions throughout the System Ashokan W2 Kensico W2
OASIS-W2 Linked ModelHow are the Models Linked? What water quality isavailable for withdrawal? What is the most reliable way to movewater around the system? CE-QUAL-W2 Schoharie Reservoir Ashokan Reservoir OASIS Model NYC Reservoir System & Delaware River Basin • Daily Water Quality Info • Turbidity (& Temp) at the Intake Daily Simulation1948 – 2004 (57 yrs) n = 20,728 days • Daily Diversion & Release Decisions • Diversions from Schoharie Reservoir • Diversions from Ashokan Reservoir • Releases from Ashokan West Basin • Operation of Ashokan Dividing Weir Gates • Alum application at Kensico
Goal: demonstrate that the model provides a reasonable simulation of how the NYC water supply system is operated OASIS assumptions: 1/1/87 - 9/30/04 Current baseline operating rules Historical demand levels Exact match is not expected due to changes in model drivers over the comparison period: Model reflects current regulations Model reflects current operating rules Model reflects current infrastructure capacities Model has all system components in service Linked OASIS-W2 Model PerformanceComparison with Historical Operations • What constitutes a reasonable simulation of operations? • Similar patterns of drawdown and refill • Conservative operations re: water supply reliability • Simulated operations are feasible and implementable • OASIS operating rules have been reviewed by DEP Ops Staff and found to provide a sound and realistic simulation of system operations
Comparison with Historical OperationsCatskill Reservoir Elevations
Comparison with Historical OperationsCatskill Turbidity Levels
Evaluation of Alternatives Alternatives • Alt 1: West Basin Outlet Structure (2000, 4000, 6000 mgd release capacity) • Alt 2: Dividing Weir Crest Gates (4’ crest gate on Dividing Weir) • Alt 3: East Basin Diversion Wall** (750’, 1700’, 2400’ wall; 3-D simulations) • Alt 4: Upper Gate Chamber Modifications (East only, East + West) • Alt 5: East Basin Intake (Single- and Multi-level intakes) • Alt 6: Catskill Aqueduct Improvements and Modified Operations • West Basin Drawdown • Waste Channel Operation (1200 mgd release capacity) • Catskill Aqueduct Improvements • Alternatives 1- 5 in combination with Alternative 6 Water Quality Performance Measures • # Days with Ashokan Diversion Turbidity > 8 NTU • # Days when Alum Treatment could be required
Proposed Alternative 6:West Basin Drawdown • Current practice: typically divert water from the East Basin • Proposed practice: divert water from West Basin during periods of low turbidity to develop/maintain a void • Reduces chance of spilling turbid water from West to East Basin during storm events • Provides slight reduction in alum treatment days; large events still require alum treatment • Operating rules can be further refined with planned Operations Support Tool (OST) • OST would link near-real time water quality data with OASIS-W2 platform and allow look-ahead simulations • OST expected to provide system-wide benefit – help balance water supply reliability, water quality, environmental objectives
Proposed Alternative 6:Waste Channel Operation • Existing Waste Channel can be used to release water from Ashokan to Esopus Creek • Current practice: not used under normal operations • Proposed practice: routine use of Waste Channel for turbidity control • Helps reduce turbid spill into East Basin • Could be used during storm events, or in anticipation of peak flows based on Esopus forecast data • Provisional operating rules could be further refined/improved with the OST • Current NYCDEP actions • Acquisition/restoration of low-lying portions of the Ashokan Field Campus • Valve improvements at Lower Gate Chamber to restore original 1200 mgd release capacity • Operations Support Tool
Proposed Alternative 6:Catskill Aqueduct Modifications • Current practice: DEP must maintain minimum flow of 275 mgd in Cat. Aq. to keep outside community (OC) taps submerged • Operation at lower flow rates requires installation of stop shutters at up to 5 locations • Cumbersome, time-consuming, emergency operation • Cannot be implemented as a routine turbidity control measure • Proposed practice: Improve DEP’s ability to operate the Catskill Aqueduct at minimum flow rates during turbidity events • 3 main options: • Improvements to stop shutter facilities • Improvements to OC taps • Connection with Delaware AqueductShaft 4 -Further study required to select among options
Catskill and Delaware Aqueducts cross, but are not connected Shaft 4 of Delaware Aqueduct was designed for a future connection Benefits Divert Delaware water into Cat. Aq. during turb events Reduce/eliminate Ashokan diversion, while maintaining supply to outside communities Improved WQ to OC’s Greater operational flexibility Improve system reliability Shaft 4 Connection
Summary of Phase III Study Findings • Reducing Catskill diversions is the most effective way to reduce alum treatment • Catskill Aqueduct Improvements & Croton WTP will dramatically increase DEP operational flexibility • Releases from Ashokan West Basin prior to or during major events also provide substantial benefit • Planned Operations Support Tool will bolster DEP ability to optimize operations for water quality & water supply reliability • Powerful modeling framework enabled a robust, performance-based evaluation of alternatives • Captures feedback between system operation and reservoir water quality • Captures a wide range (57 years) of forcing conditions to represent long-term performance • Worthwhile evaluating alternatives using a robust modeling framework before making major capital decisions
Operations during Catskill Turbidity Events:System Diversions • Catskill Aqueduct diversion turbidity > 8 NTU • Minimize diversions from the Catskill System • Increase diversions from the Delaware and Croton Systems • Minimum diversion from the Catskill System • Baseline Operations: Cut back to 275 mgd (minimum flow needed to satisfy outside community demands without installing stop shutters at 5 locations along the Catskill Aqueduct) • Alt. 6 Catskill Aqueduct Improvements (and combined alts): Cut back to the minimum flow possible while still satisfying NYC and outside demands • Maximum flow from Delaware System: 890 mgd • Maximum flow from Croton System: 160 mgd (Current Conditions) 290 mgd (Post-Croton Filtration)
Operations during Catskill Turbidity Events:Alum Application • Alum application at Kensico is approximated using a simple rule based on Catskill Aqueduct turbidity load: • Alum on when load > 5,000 mgd*NTU • Alum off when load < 4,000 mgd*NTU (5-day running average basis) • Alum rule is a simple surrogate for the actual decision-making process, which is more complex and depends on: • Delaware System turbidity levels • Overall system status • Time of year • Extent of stratification in Kensico • ‘Look-ahead’ modeling of Kensico diversion turbidity levels • Alum rule is a simple surrogate and should be interpreted as days when alum application could be required • Focus on relative performance of alternatives
Alt 1: West Basin Outlet StructureOperating Rules • Physical alternatives: • Outlet Structure with weir elevation 585’ • 3 max capacities evaluated: 2000, 4000, 6000 mgd(actual flow is head-dependent) • Outlet Structure with multi-level withdrawal capability (4000 mgd) • Operated to withdraw from strata with highest turbidity water • Rules • Short-term: release the amount expected to spill into the East Basin, based on 2-day AHPS* inflow forecast • Long-term (snowpack management): release the amount needed to maintain void equal to half the snowpack volume • Outlet Structure operated only when 1200 mgd release capacity via Waste Channel is insufficient to meet the above objectives *AHPS = Advanced Hydrologic Prediction Service; provides 24 and 48hr forecasts of Esopus Creek flow at Coldbrook
Alt 6: Catskill Aqueduct Improvements and Modified Operations: Operating Rules • Mod Ops 1: West Basin Drawdown • Make diversions from W. Basin whenever turb < 5 NTU and E. Basin has more than 1’ freeboard • Mod Ops 2: Optimize Operation of Existing Waste Channel • 1200 mgd capacity (after planned valve repairs) • Short-term: release the amount expected to spill to the E. Basin • Long-term: maintain void equal to half the snowpack volume • Catskill Aqueduct Improvements • Improve ability to readily operate at flows <275 mgd while still meeting outside community demands • Turbidity > 8 NTU: reduce Catskill diversion to the minimum flow possible while still satisfying NYC and outside demands
Sensitivity and Uncertainty Analysis for 2D Ashokan Reservoir Model • Examined sensitivity of predictions to model drivers and model parameters • Parameters/drivers examined included: • Hydrodynamic model coefficients (n = 7 parameters) • Thermal model coefficients (n = 3) • Turbidity sub model coefficients (n = 3) • Model boundary conditions / drivers (n = 10) • Bathymetry (n = 3) • Representation of variability in drivers more important than uncertainty in model parameters • Dominant source of uncertainty for performance of alternatives is Esopus Creek Q-Tn relationship • Evaluated multiple turbidity loading scenarios; developed Monte Carlo approach to accommodate inter-event variability