Download
1 / 11
110 likes | 204 Views
Explore the potential for new physics through rare decays of Bs and Bd mesons to muon pairs at the Tevatron collider. Results from SUSY models and R-parity violating scenarios are discussed, with implications for observing deviations from Standard Model predictions. Limits on branching fractions and exclusion regions in mSUGRA and SO(10) unification models are presented. The importance of these measurements in constraining new physics scenarios is highlighted for future research.

E N D
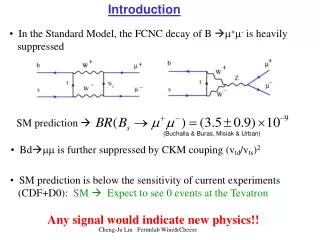
Introduction • In the Standard Model, the FCNC decay of B m+m- is heavily • suppressed SM prediction (Buchalla & Buras, Misiak & Urban) • Bdmm is further suppressed by CKM couping (vtd/vts)2 • SM prediction is below the sensitivity of current experiments • (CDF+D0): SM Expect to see 0 events at the Tevatron • Any signal would indicate new physics!! Cheng-Ju Lin Fermilab Wine&Cheese
BEYOND STANDARD MODEL • In many SUSY models, the BR could be enhanced by many • orders of magnitude: • For example: • - MSSM: Br(Bmm) is • proportional to tan6b • - Br(B mm) also • enhanced at high tanb in • GUT SO(10) models • - BR could be as large as • 10-1000 times the SM prediction Would be observable at the Tevatron Cheng-Ju Lin Fermilab Wine&Cheese
BEYOND STANDARD MODEL • Another example: • R-Parity violating SUSY • - Tree level diagram is allowed in • R-parity violating (RPV) SUSY • models. • - Possible to observe decay • even for low value of tanb • - Enhancement depends strongly • on coupling constants (l , l’) R-parity violating SUSY m b ~ n l’i23 l i22 m s Would also be observable at the Tevatron Cheng-Ju Lin Fermilab Wine&Cheese
PROBE OF NEW PHYSICS Monte Carlo • New physics may enhance Bs and • Bdmm differently • Minimal-flavor-violation (MFV) • assumption in SUSY yields SM • relations between Bs and Bdmm • decays • Can observe both Bs and Bd: unique to • Tevatron • CDF has the mass resolution to • distinguish two decays, s(Mmm)~23MeV : • unique to CDF • Either observation or null search, results will provide important • clues about possible scenarios of new physics beyond SM M(Bs)-M(Bd)~90MeV
Limits Summary Bs: we observed 0 events which yields a combined limit of: 1.6×10⁻⁷ @ 90% CL 2.1×10⁻⁷ @ 95% CL Bd: we observed 0 events which yields a combined limit of: 3.9×10⁻⁸ @ 90% CL 5.1×10⁻⁸ @ 95% CL Br(Bsmm) < 4.1×10⁻⁷ @ 90% CL ; D0 PRL 94 (2005) 042001 Br(Bsmm) < 5.8×10⁻⁷ @ 90% CL ; CDF PRL 93 (2003) 032001 Br(Bdmm) < 3.0×10⁻⁷ @ 90% CL ; D0 Preliminary 4733 Br(Bdmm) < 8.0×10⁻⁸ @ 90% CL ; (BaBar PRL 94 (2005) 221803 Both CDF Bs and Bd results are x2 better than the best published result!!!
B. Dutta, U. Regina m b R-parity violating SUSY ~ n l’i23 l i22 m s RPV SUSY EXCLUSION • Possible to exclude phase space • even for small tan(b) • Exclusion strongly depends on the • coupling. Excluded
Dedes, Dreiner, Nierste, PRL 87(2001) 251804 mSUGRA M0 vs M1/2 Excluded • We are beginning to carve • into mSUGRA space • For mh~115GeV implies • 10-8<Br(Bsmm)<3×10⁻⁷ M0 [GeV] Excluded Solid red = excluded by theory or experiment Dashed red line = light Higgs mass (mh) Dashed green line = (dam)susy (in units of 10-10) Black line = Br(Bsmm)
Dedes, Dreiner, Nierste, PRL 87(2001) 251804 mSUGRA M0 vs M1/2 Excluded • We are beginning to carve • into mSUGRA space • For mh~115GeV implies • 10-8<Br(Bsmm)<3×10⁻⁷ M0 [GeV] Excluded by this new result Excluded Solid red = excluded by theory or experiment Dashed red line = light Higgs mass (mh) Dashed green line = (dam)susy (in units of 10-10) Black line = Br(Bsmm)
SO(10) Unification Model R. Dermisek et al., hep-ph/0304101 • tan(b)~50 constrained by • unification of Yukawa coupling • White region is not excluded • Unification valid for small M1/2 • (~500GeV) h2>0.13 mh<111GeV m+<104GeV Red regions are excluded by either theory or experiments Green region is the WMAP preferred region Blue dashed line is the Br(Bsmm) contour Light blue region excluded by old Bsmm analysis
SO(10) Unification Model R. Dermisek et al., hep-ph/0304101 • tan(b)~50 constrained by unification • of Yukawa coupling • All previously allowed regions (white) • are excluded by this new measurement • Unification valid for small M1/2 • (~500GeV) • New Br(Bsmm) limit strongly • disfavors this solution for • mA= 500 GeV h2>0.13 mh<111GeV m+<104GeV Excluded by this new result Red regions are excluded by either theory or experiments Green region is the WMAP preferred region Blue dashed line is the Br(Bsmm) contour Light blue region excluded by old Bsmm analysis
BsLimit Projection • Extrapolate based on the • current analysis which was • optimized for 1/fb • Assume background scales • linearly with luminosity • Will need to re-optimize the • analysis for > 3/fb Cheng-Ju Lin Fermilab Wine&Cheese


