Download
1 / 74
740 likes | 866 Views
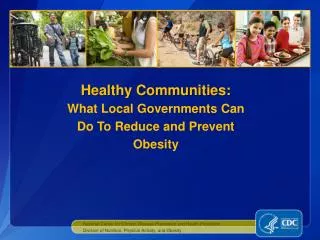
Healthy Communities: What Local Governments Can Do To Reduce and Prevent Obesity. Division of Nutrition, Physical Activity, and Obesity. National Center for Chronic Disease Prevention and Health Promotion. Overview of the Obesity Epidemic How Did We Get Here?

E N D
Healthy Communities:What Local Governments Can Do To Reduce and Prevent Obesity Division of Nutrition, Physical Activity, and Obesity National Center for Chronic Disease Prevention and Health Promotion
Overview of the Obesity Epidemic How Did We Get Here? Why Should Local Governments Care? Policy & Environmental Change to Address Obesity CDC Recommended Community Strategies and Measurements to Prevent Obesity Presentation Overview
Obesity Trends* Among U.S. Adults, BRFSS 1990 (1)(*BMI ≥30, or ~ 30 lbs. overweight for 5’ 4” person) No Data <10% 10%–14%
Obesity Trends* Among U.S. Adults, BRFSS 1991(*BMI ≥30, or ~ 30 lbs. overweight for 5’ 4” person) No Data <10% 10%–14% 15%–19%
Obesity Trends* Among U.S. Adults, BRFSS 1992(*BMI ≥30, or ~ 30 lbs. overweight for 5’ 4” person) No Data <10% 10%–14% 15%–19%
Obesity Trends* Among U.S. Adults, BRFSS 1993(*BMI ≥30, or ~ 30 lbs. overweight for 5’ 4” person) No Data <10% 10%–14% 15%–19%
Obesity Trends* Among U.S. Adults, BRFSS 1994(*BMI ≥30, or ~ 30 lbs. overweight for 5’ 4” person) No Data <10% 10%–14% 15%–19%
Obesity Trends* Among U.S. Adults, BRFSS 1995(*BMI ≥30, or ~ 30 lbs. overweight for 5’ 4” person) No Data <10% 10%–14% 15%–19%
Obesity Trends* Among U.S. Adults, BRFSS 1996(*BMI ≥30, or ~ 30 lbs. overweight for 5’ 4” person) No Data <10% 10%–14% 15%–19%
Obesity Trends* Among U.S. Adults, BRFSS 1997(*BMI ≥30, or ~ 30 lbs. overweight for 5’ 4” person) No Data <10% 10%–14% 15%–19% ≥20%
Obesity Trends* Among U.S. Adults, BRFSS 1998(*BMI ≥30, or ~ 30 lbs. overweight for 5’ 4” person) No Data <10% 10%–14% 15%–19% ≥20%
Obesity Trends* Among U.S. Adults, BRFSS 1999(*BMI ≥30, or ~ 30 lbs. overweight for 5’ 4” person) No Data <10% 10%–14% 15%–19% ≥20%
Obesity Trends* Among U.S. Adults, BRFSS 2000(*BMI ≥30, or ~ 30 lbs. overweight for 5’ 4” person) No Data <10% 10%–14% 15%–19% ≥20%
Obesity Trends* Among U.S. Adults, BRFSS 2001(*BMI ≥30, or ~ 30 lbs. overweight for 5’ 4” person) No Data <10% 10%–14% 15%–19% 20%–24% ≥25%
Obesity Trends* Among U.S. Adults, BRFSS 2002(*BMI ≥30, or ~ 30 lbs. overweight for 5’ 4” person) No Data <10% 10%–14% 15%–19% 20%–24% ≥25%
Obesity Trends* Among U.S. Adults, BRFSS 2003(*BMI ≥30, or ~ 30 lbs. overweight for 5’ 4” person) No Data <10% 10%–14% 15%–19% 20%–24% ≥25%
Obesity Trends* Among U.S. Adults, BRFSS 2004(*BMI ≥30, or ~ 30 lbs. overweight for 5’ 4” person) No Data <10% 10%–14% 15%–19% 20%–24% ≥25%
Obesity Trends* Among U.S. Adults, BRFSS 2005(*BMI ≥30, or ~ 30 lbs. overweight for 5’ 4” person) No Data <10% 10%–14% 15%–19% 20%–24% 25%–29% ≥30%
Obesity Trends* Among U.S. Adults, BRFSS 2006(*BMI ≥30, or ~ 30 lbs. overweight for 5’ 4” person) No Data <10% 10%–14% 15%–19% 20%–24% 25%–29% ≥30%
Obesity Trends* Among U.S. Adults, BRFSS 2007(*BMI ≥30, or ~ 30 lbs. overweight for 5’ 4” person) No Data <10% 10%–14% 15%–19% 20%–24% 25%–29% ≥30%
Obesity Trends* Among U.S. Adults, BRFSS 2008(*BMI ≥30, or ~ 30 lbs. overweight for 5’ 4” person) No Data <10% 10%–14% 15%–19% 20%–24% 25%–29% ≥30%
Obesity Trends* Among U.S. Adults, BRFSS 2009(*BMI ≥30, or ~ 30 lbs. overweight for 5’ 4” person) No Data <10% 10%–14% 15%–19% 20%–24% 25%–29% ≥30%
Between 1980–2008, obesity prevalence among U.S. adults doubled (2,3), and recent data indicate an estimated 34% of adults are obese (BMI ≥ 30) (4) . More than one in six U.S. children is obese, three times the rate in the 1970’s (BMI at or above the 95% percentile of the sex specific BMI for age growth charts) (5). According to 2006-2008 self reported data, Blacks had 51% higher prevalence of obesity, and Hispanics had 21% higher obesity prevalence compared with whites (6). Obesity Statistics
Overview of the Obesity Epidemic How Did We Get Here? Why Should Local Governments Care? Policy & Environmental Change to Address Obesity CDC Recommended Community Strategies and Measurements to Prevent Obesity Presentation Overview
Increased consumption of sugar sweetened beverages Continued low consumption of fruitsand vegetables Dietary Behaviors
Increased frequency of meals eaten away from home Dietary Behaviors
Increased number of fast food establishments in the U.S. Lack of access to full service grocery stores selling affordable healthful foods Less healthy food & beverage advertising aimed at children The Food Environment
35.5% of adults do not engage in recommended levels of physical activity for health benefits (21) and 25.4% of adults report no leisure-time activity (23) In 2009, 81.6% of high school students did not participate in 60 or more minutes of physical activity on any day of the previous 7 days (22). Only 30.3% of high school students, grades 9-12, have daily P.E. (23). Physical Activity
Standardized Share of Mode for Trips to School:National Personal Transportation Survey Community Design & the Built Environment Car Bus Walk/bike Public Transit McDonald NC. Am J Prev Med 2007;32:509
Environmental factors beyond the control of individuals contribute to increased obesity rates by reducing the likelihood of healthy eating and active living behaviors. Environmental factors that influence physical activity behavior (26, 27): Lack of infrastructure supporting active modes of transportation, i.e. sidewalks & bike facilities Access to safe places to play and be active Access to public transit Mixed use & Transit Oriented Developments Community Design & the Built Environment
Overview of the Obesity Epidemic How Did We Get Here? Why Should Local Governments Care? Policy & Environmental Change to Address Obesity CDC Recommended Community Strategies and Measurements to Prevent Obesity Presentation Overview
The Cost of Obesity is High: In 2008, the annual healthcare cost of obesity in the US was estimated to be as high as 147 billion dollars a year, double the amount a decade ago (28). Annual medical expenses for the obese are estimated to be 42 percent higher than for a person of a healthy weight (28). Workplace obesity prevention programs may be an effective way for employers, including local governments, to reduce obesity, lower health care costs, lower absenteeism, and increase employee productivity. Why Should Local Governments Care?
Local government officials are community leaders and can enact policies that support healthy community design For example, local zoning ordinances & economic incentives affect the presence and absence of: Parks and open spaces for recreation Bike facilities Mixed use developments Healthy food retailers & farmers markets Why Should Local Governments Care?
Policies and environments that affect peoples’ health are determined by a variety of local government entities, including: City Councils/County Commissions Zoning Boards School Districts Transportation & Planning departments Parks & Recreation departments Local Government Can Be Part of the Solution
Potential forsystemic changein a community’s food and physical activity environment. Broad Reach: Opportunity to “level the playing field”for all members of a community, including disproportionately impacted populations. Flexibility: Consider the unique characteristics and needs of your community and implement obesity prevention initiatives to address them. Advantages of Policy & Environmental Change to Address Obesity:
Policy-based strategies have proven very effectivein other major public health battles, for example, the tobacco control movement. Local Policy Example: After a decade with no decrease in smoking, New York City implemented a five point tobacco control program, which included two policy initiatives: aggressive increases in cigarette taxation (2002) and smoke free air legislation (2003). During 2002-2004, estimated adult smoking prevalence decreased from 21.5% to 18.4%, representing nearly 200,000 fewer smokers in New York city (29-31). Advantages of Policy & Environmental Initiatives to Address Obesity:
What can local governments do right now to address obesity? Enact policy and environmental initiatives that support healthy eating and active living Partner with a variety of local agencies to leverage resources and achieve greater impact (i.e. Planning Dept, Economic Redevelopment Agency, Parks & Recreation Dept, Public Health Dept) Set feasible short and long term goals to address the unique needs of your community Measure your community’s performance and adjust goals as necessary Call To Action
Overview of the Obesity Epidemic How Did We Get Here? Why Should Local Governments Care? Policy & Environmental Change to Address Obesity CDC Recommended Community Strategies and Measurements to Prevent Obesity Presentation Overview
CDC focuses on six target behaviors for the prevention of obesity and other chronic diseases Increase physical activity Increase consumption of fruits and vegetables Increase breastfeeding initiation, duration, and exclusivity Decrease consumption of sugar sweetened beverages Decrease consumption of high energy dense, nutrient poor, foods Decrease television viewing Target Behaviors for Change
CDC Framework for Preventing Obesity(adapted from IOM 2005) Social Norms and Values • Home and Family • School • Community • Work Site • Healthcare • Food and Beverage Industry • Agriculture • Education • Media • Government • Public Health Systems • Healthcare Industry • Business and Workers • Land Use and Transportation • Leisure and Recreation Sectors of Influence Behavioral Settings • Genetics • Psychosocial • Other Personal Factors Individual Factors Food and Beverage Intake Physical Activity Energy Intake Energy Expenditure Energy Balance Prevention of Overweight and Obesity Among Children, Adolescents, and Adults Draft – last revised, March 24, 2005
Goal:Improve the street environment for non-motorized users; enhance aesthetics; affect driving behavior Policy:Enacted a downtown-wide traffic calming policy Outcome: Enhanced traffic safety Enhanced personal safety Increased street connectivity Increased mixed-use zoning Example: West Palm Beach, FL (32)
Before: Example: West Palm Beach, FL
After two-way traffic wide shaded sidewalks Example: West Palm Beach, FL
After: raised intersections shortened pedestrian crosswalks narrowed streets on street parking Example: West Palm Beach, FL
After Renovated abandoned buildings for mixed use development Example: West Palm Beach, FL
After Example: West Palm Beach, FL
Goal: Increase access to affordable healthier foods Environmental Change: Implemented a farmers market that was culturally and economically appropriate for the community. Outcome: Created an incentive program for WIC & food stamp beneficiaries to shop at the market Instructions for vendors on how to accept food stamps Promotional materials produced in four languages Increases in attendance, the percentage of foreign born and low income patrons, & the redemption rate of WIC Special Supplemental Nutrition Program vouchers Example: Somerville, MA (33)
Goal: Increase community access to safe places for physical activity Policy Change: Established a Joint Use Agreement that opens up school recreation facilities and resources for public use. Public use of school facilities during after-school hours, on weekends, and non-school days. Shared recreation facilities include: gymnasiums, swimming pools, tennis courts, and athletic fields. Shared responsibility for facility maintenance and repair costs. Example: City of Corning and Corning Union School District, CA (36)
Goal: Decrease consumption of Sugar Sweetened Beverages among children age six and under. Policy Change: The NY City Board of Health amended its health code to prohibit serving beverages with added sweeteners and places limits on beverages served in licensed day care facilities. Limits the serving size of 100% fruit juice to 6 oz per day for children 8 months and older When milk is served, children 2 years of age and older must receive low-fat 1% or non fat milk Water must be readily available throughout the day Example: New York City (34)
Overview of the Obesity Epidemic How Did We Get Here? Why Should Local Governments Care? Policy & Environmental Change to Address Obesity CDC Recommended Community Strategies and Measurements to Prevent Obesity Presentation Overview