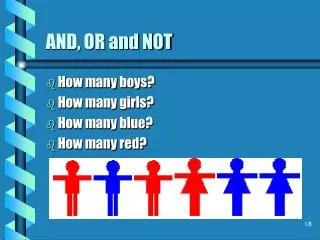
AND
AND. Chapter 13. Statistics. WHAT YOU WILL LEARN. • Mode, median, mean, and midrange • Percentiles and quartiles • Range and standard deviation. Section 5. Measures of Central Tendency. Definitions. An average is a number that is representative of a group of data.


AND
E N D
Presentation Transcript
Chapter 13 Statistics
WHAT YOU WILL LEARN • Mode, median, mean, and midrange • Percentiles and quartiles • Range and standard deviation
Section 5 Measures of Central Tendency
Definitions • An average is a number that is representative of a group of data. • The arithmetic mean, or simply the mean, is symbolized by , when it is a sample of a population or by the Greek letter mu, , when it is the entire population.
Mean • The mean, , is the sum of the data divided by the number of pieces of data. The formula for calculating the mean is • where represents the sum of all the data and n represents the number of pieces of data.
Example-find the mean • Find the mean amount of money parents spent on new school supplies and clothes if 5 parents randomly surveyed replied as follows: $327 $465 $672 $150 $230
middle value (median) Median • The median is the value in the middle of a set of ranked data. • Example: Determine the median of $327 $465 $672 $150 $230. Rank the data from smallest to largest. $150 $230 $327 $465 $672
7 8 Example: Median (even data) • Determine the median of the following set of data: 8, 15, 9, 3, 4, 7, 11, 12, 6, 4. Rank the data: 3 4 4 6 7 8 9 11 12 15 There are 10 pieces of data so the median will lie halfway between the two middle pieces (the 7 and 8). The median is (7 + 8)/2 = 7.5 3 4 4 6 9 11 12 15 Median = 7.5
Mode • The mode is the piece of data that occurs most frequently. • Example: Determine the mode of the data set: 3, 4, 4, 6, 7, 8, 9, 11, 12, 15. • The mode is 4 since it occurs twice and the other values only occur once.
Midrange • The midrange is the value halfway between the lowest (L) and highest (H) values in a set of data. • Example: Find the midrange of the data set$327, $465, $672, $150, $230.
Example • The weights of eight Labrador retrievers rounded to the nearest pound are 85, 92, 88, 75, 94, 88, 84, and 101. Determine the a) mean b) median c) mode d) midrange e) rank the measures of central tendency from lowest to highest.
Example--dog weights 85, 92, 88, 75, 94, 88, 84, 101 (continued) a. Mean b. Median-rank the data 75, 84, 85, 88, 88, 92, 94, 101 The median is 88.
Example--dog weights 85, 92, 88, 75, 94, 88, 84, 101 c. Mode-the number that occurs most frequently. The mode is 88. d. Midrange = (L + H)/2 = (75 + 101)/2 = 88 e. Rank the measures, lowest to highest 88, 88, 88, 88.375
Measures of Position • Measures of position are often used to make comparisons. • Two measures of position are percentiles and quartiles.
To Find the Quartiles of a Set of Data 1. Order the data from smallest to largest. 2. Find the median, or 2nd quartile, of the set of data. If there are an odd number of pieces of data, the median is the middle value. If there are an even number of pieces of data, the median will be halfway between the two middle pieces of data.
To Find the Quartiles of a Set of Data (continued) 3. The first quartile, Q1, is the median of the lower half of the data; that is, Q1, is the median of the data less than Q2. 4. The third quartile, Q3, is the median of the upper half of the data; that is, Q3is the median of the data greater than Q2.
Example: Quartiles • The weekly grocery bills for 23 families are as follows. Determine Q1, Q2, and Q3. 170 210 270 270 280 330 80 170 240 270 225 225 215 310 50 75 160 130 74 81 95 172 190
Example: Quartiles (continued) • Order the data: 50 74 75 80 81 95 130 160 170 170 172 190 210 215 225 225 240 270 270 270 280 310 330 Q2 is the median of the entire data set which is 190. Q1 is the median of the numbers from 50 to 172 which is 95. Q3 is the median of the numbers from 210 to 330 which is 270.
Section 6 Measures of Dispersion
Measures of Dispersion • Measures of dispersion are used to indicate the spread of the data. • The range is the difference between the highest and lowest values; it indicates the total spread of the data. Range = highest value – lowest value
Example: Range • Nine different employees were selected and the amount of their salary was recorded. Find the range of the salaries. $24,000 $32,000 $26,500 $56,000 $48,000 $27,000 $28,500 $34,500 $56,750 • Range = $56,750 $24,000 = $32,750
Standard Deviation • The standard deviation measures how much the data differ from the mean. It is symbolized with s when it is calculated for a sample, and with (Greek letter sigma) when it is calculated for a population.
To Find the Standard Deviation of a Set of Data 1. Find the mean of the set of data. 2. Make a chart having three columns: Data Data Mean (Data Mean)2 3. List the data vertically under the column marked Data. 4. Subtract the mean from each piece of data and place the difference in the Data Mean column.
To Find the Standard Deviation of a Set of Data (continued) 5. Square the values obtained in the Data Mean column and record these values in the (Data Mean)2 column. 6. Determine the sum of the values in the (Data Mean)2 column. 7. Divide the sum obtained in step 6 by n 1, where n is the number of pieces of data. 8. Determine the square root of the number obtained in step 7. This number is the standard deviation of the set of data.
Example • Find the standard deviation of the following prices of selected washing machines: $280, $217, $665, $684, $939, $299 Find the mean.
Data Data Mean (Data Mean)2 217 297 (297)2 = 88,209 280 234 54,756 299 215 46,225 665 151 22,801 684 170 28,900 939 425 180,625 0 421,516 Example (continued), mean = 514
Example (continued), mean = 514 • The standard deviation is $290.35.