Download
1 / 31
310 likes | 455 Views
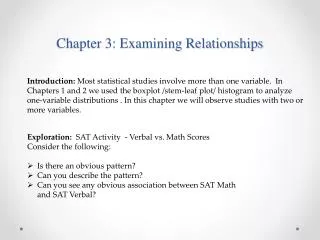
Chapter 2 Examining Relationships . Response variable measures outcome of a study (dependent variable) Explanatory variable explains or influences changes in response variable (independent) Practice: pg 81 #2.1, 2.2. 2.1 Scatterplots. Scatterplot.

E N D
Response variable measures outcome of a study (dependent variable) • Explanatory variable explains or influences changes in response variable (independent) • Practice: pg 81 #2.1, 2.2
Scatterplot • shows relationship between two quantitative variables measured on the same individuals • most common way to display relation between two variables • Example using calculator: pg 83 #2.4 powerboats vs. manatees killed
Examining a scatterplot • Look for overall pattern and deviations from the pattern • Describe overall shape by the form, direction, and strength of the relationship • Look for outliers
Look for: • positively and negatively associated • strength is determined by how closely the points follow a clear form (use strong or weak)
Adding categorical variables to scatterplots use different colors or symbols to plot points • Practice: pg. 89 #2.7
Section 2.1 practice problems: pg 91 #2.8, 9, 10, 11
Correlation • A linear relationship is strong if the points lie close to a straight line. Our eyes are not good judges of strength of linear relationship • measures the direction and strength of the linear relationship between two quantitative variables • equation: • to calculate on calculator: calculate with manatees
Correlation • r is the average product of z-scores • r is positive when there is a positive association • r requires that both variables be quantitative • r has no unit of measure its just a number
r is strongly affected by outliers • r is used along with the mean and standard deviation to describe two-variable data
Section 2.2 practice problems pg 103 2.21, 24, 29
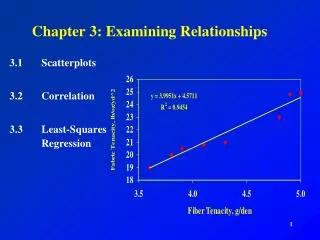
least-squares regression line • regression line is a straight line that describes how a response variable (y) changes as an explanatory variable (x) (best fit line) • standard line that doesn’t depend on our guess as to where the line should go
line that makes the sum of the squares of the vertical distances of the data points from the line as small as possible • to calculate the equation of regression line with calculator:
Facts about least-squares regression • the least-squares regression looks at distance from y to line (not x) so you cannot switch the x and y variables and get the same line • the least-squares regression line always passes through the point (x,y) • the square of the correlation is the proportion of data accounted for by the least-square regression line • when you report a regression, give r2 as a measure of how successful the regression was in explaining the response • Practice problems: pg 114 #2.33, 34
Residuals • the difference between an observed value of the response variable and the value predicted by the regression line (y-ŷ) • to calculate residuals on calculator: • examining residuals helps assess how well the line describes the data • the mean of the residuals is always zero • residual plot is a scatterplot of the regression residuals against the explanatory variable to help assess the fit of a regression line • Make residual plot of manatees data
Things to look for in residual plot • Curved pattern – shows relationship is not linear • Increasing or decreasing spread – prediction of y when x is large will be less accurate • Individual points with large residuals – these points are outliers • Individual points that are extreme in the x direction
Consider the following data on x=height (in inches) and y=average weight (in pounds) for American females, age 30-39 • X 58 59 60 61 62 63 64 65 66 67 • Y 113 115 118 121 124 128 131 134 137 141 • X 68 69 70 71 72 • Y 145 150 153 159 164 • Make scatterplot. Is the data linear? • Plot residual plot.
Practice: pg 122 #2.36, 37 • Section 2.3 practice: pg 124 # 2.42, 44, 45, 47, 48
Extrapolation • use of a regression line for prediction far outside the range of values of the explanatory variable (x) that you used to obtain the line • often is not accurate
Using averaged data • average temp, average, salary, average age, etc. • do not apply results to individuals • correlations based on averages are usually too high when applied to individuals
Lurking variables • sometimes the relationship between two variables is influenced by other variables that were not measured or even thought about
Association is not causation • a strong association does not necessarily mean that x causes y • example: manatee deaths vs powerboat registrations
Section 2.4 practice: pg 136 2.57, 58, 59