Download

1 / 17
170 likes | 194 Views
This paper discusses credit risk modeling insights based on one million observations related to drawdown behavior in small businesses with lines of credit. It delves into biases, risk management tools, and the implications of line size changes on risk. Suggestions for further analysis and understanding systematic risk are also provided.

E N D
Three Papers Related To Credit Risk Modeling Discussion by Mark Carey Federal Reserve Board FDIC CFR Conference September, 2006 The opinions expressed herein are my own, not necessarily those of the Board of Governors or the Federal Reserve System.
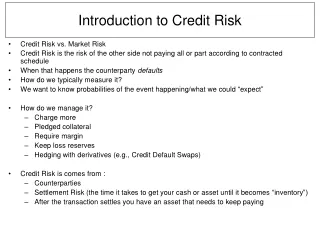
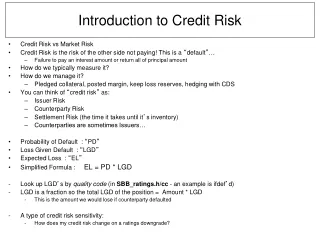
“…One Million…Observations…” by Jiménez, Lopez & Saurina • Firms draw down lines of credit more as they approach default. • Some loan, borrower and cyclical characteristics are correlated with drawdown behavior. • Nice! Important!
“…One Million Observations…” Some things to keep in mind • This paper tells us about small business behavior (max. line size is €600,000). • By construction: Big firms tend to have multiple banking relationships, and firms with such relationships are excluded. • We should not expect to see results implying intense monitoring or complex contracts. Small-loan revenue can’t support the costs.
“…One Million Observations…” The big open question: Size of bias • Does risk borne by the bank increase or decrease with measured usage? • Does measured usage increase because more euros are borrowed, or because size of the credit line is reduced? • Reductions in line size, a primary risk management tool, are treated differently • A new observation is created when line size changes. This introduces an implicit bias.
“…One Million Observations…” The paper’s implicit scenario:Amount at risk rises, usage increases…
“…One Million Observations…” But results could also be driven bydecreasing line size as risk increases…
“…One Million Observations…” Suggestions • Please report line size behavior • Could be interesting to partition by bank. Banks may differ in their risk management. • Especially with so many observations, economic significance of parameter estimates matters more than statistical significance. Tell the reader more about which covariates matter economically.
Miu et al’s Discount Rate For Workout RecoveriesOr Can we predict r = IRR(Y,X,t) ? Y = Ultimate Recovery X = Post-Default Price
Miu et al’s Discount Rate For Workout RecoveriesAre we happy slicing-and-dicing this IRR? No. • Michael Gordy and I tried the authors’ method in 2002-2003 and were unsatisfied. We felt we must pursue deeper understanding. • We want to understand the systematic risk that is the source of any risk premium. • One discomfort: Regression Y = aX delivers a=1, but R2 is only about 0.03, N small. We worried that slicing-and-dicing will extract noise. Need some good structure on the problem. • Symptom in today’s results: Should we be happy that r = 28% for Senior Unsecured and 4% for Senior Subordinated? Green-dot and black-triangle variation aren’t THAT different.
Miu et al’s Discount Rate For Workout RecoveriesThe main problem with the research strategy • Authors are computing IRR from a European option price and its payoff at maturity. • They partition using characteristics related to both systematic variation in payoff AND details of option contracts which transform the systematic variation (like strike prices). • Just as an equity beta is a function of a firm’s asset beta and it’s leverage, the systematic risk in an option depends on the underlying and the details of the option contract. • Carey & Gordy’s evidence shows debt structure is a major determinant of the payoff AND of the option characteristics. Which do we learn about if r is partitioned by debt structure? • The authors’ methodology is fundamentally likely to confuse us about what’s really happening with risk and value.
Part of Carey & Gordy’s way forward:Firm-level LGD is the underlying • As with any debt instrument, view defaulted debt as a contingent claim on the value of the firm, but at emergence or liquidation. • Bankruptcy changes legalities and nature of option. • U.S. system of absolute priority implies like collar options. • Upper and lower strike determined by place in queue. • Suppose Loan=50 loses 0%; Bond=100 loses 50%; Subdebt=50 loses 100%. • Total recovery is $100, total claims are $200, so firm-level LGD=50%
Part of Carey & Gordy’s way forward:Debt instruments as collar options Whether claims are in-the-money…. Depends on the value of the firm at emergence and debt structure. Deeply subordinated Contractually subordinated Firm B at emergence General unsecured claims Other secured Firm A at emergence Well-secured Lawyers Then model price of this. Model and understand this first.
Part of Carey & Gordy’s way forward:Firm-level vs. Instrument-level ultimate LGD distributions: Evidence option view useful
Part of Carey & Gordy’s way forward:Two potential sources of systematic risk Strike prices (boundaries of layers) might depend on state of the world…. Size of cash flows at emergence (or their valuations) might depend on state of the world. Deeply subordinated Contractually subordinated Firm B at emergence General unsecured claims Other secured Firm A at emergence Well-secured Lawyers Capital structure, especially bank debt share, has a big effect on firm LGD AND on degree of magnification of second by virtue of option structure. In addition to selection issues, this makes use of such variables to partition a pool of instrument-level IRRs problematic.
Düllmann & Masschelein’s “Sector Concentration in Loan Portfolios” • A portfolio that is not fully diversified across sectors has larger (default mode) credit VaR • Variations in sector concentration across banks are likely to be material for economic capital requirements. Thus supervisors have a material Pillar 2 role to play in ensuring actual capital is adequate to cover the concentrations. • An analytic formula does a pretty good job approximating “true” VaR • This paper is providing a helpful tool, based on standard portfolio credit modeling technology.
“Sector Concentration in Loan Portfolios”Is the glass half full or half empty? • Related to recent papers by Pesaran, Schuermann & coauthors • Schuermann et al marry a global macro model with portfolio credit models. One finding is substantial reductions in measured credit VaR for globally diversified portfolios, relative to a restricted single-risk-factor case. • Why does this conclusion sound inconsistent? • The authors’ exercise is different • Here a specific multifactor assumption is maintained and exposure to the factors is varied, with more concentrated exposure naturally reducing the assumed benefits of diversification that are built into the Basel II benchmark. • Here the Basel II full-market single-factor setup is implicitly assumed to be the benchmark, so any reduction of diversification must imply larger credit VaR
“Sector Concentration in Loan Portfolios”A useful tool, but we must not stop thinking.. • I like what the authors have done. • The paper’s model can help examiners (and banks) benchmark one bank against another. • Such tools will be of significant practical, operational importance in the bank-supervisor relationship. • Bringing tools to the front line encourages ownership. • But supervisors should also be trying to take a view about what factor mix, and factor loadings, are reasonable. The authors would not claim this tool is enough to inform such a view…users of the tool should also not fall into such a trap. • There is no easy way to develop an informed view. One must grapple with the many devils in the details. • One such devil is that, clearly now, national and industry factors are not enough, especially for small (CDO) portfolios. Longstaff et al results.