Download
1 / 58
640 likes | 833 Views
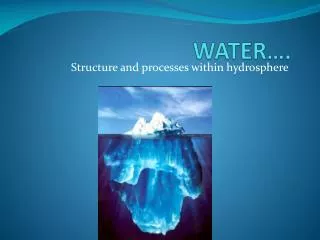
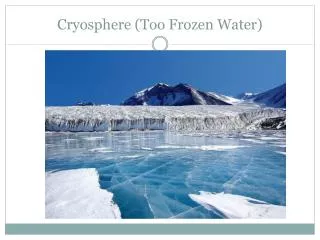
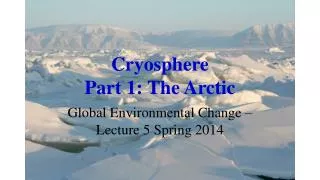
Cryosphere (Frozen water). The shape of ice crystals cause ice to be less dense than liquid water This causes Ice to float with about 9% of the ice volume above water (91% below). A.k.a. the Tip of the iceberg. Time scales relevant to the cryosphere. 87% of ice is in Antarctica

E N D
The shape of ice crystals cause ice to be less dense than liquid water This causes Ice to float with about 9% of the ice volume above water (91% below). A.k.a. the Tip of the iceberg.
87% of ice is in Antarctica 10% Greenland 2.5% ice shelves (mostly Antarctic) If all Ice melted sea levels would go up by about 65 meters (213 ft)
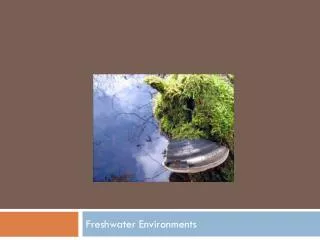
Snow cover Essential for water resources in the western US Roughly 75% of the Western US fresh water supply comes from snow pack.
Alpine Glaciers Milk Lake 2009 Milk Lake glacier 1988
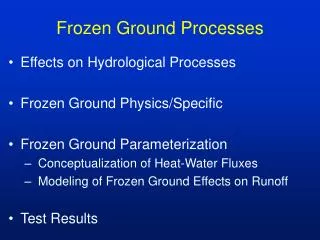
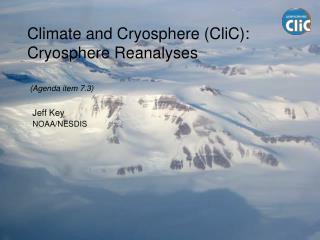
Methane possibly released from permafrost? Methane change Since 2005
See http://www.aber.ac.uk/greenland/Massbalance.html and Gravity Recovery And Climate Experiment From Grace Right: Mass change distribution (2002-2009) across the ice sheet as determined by GRACE observations.
Land Ice http://www.skepticalscience.com/east-antarctica-is-now-losing-ice.html
Ablation: Melt, sublimation, loss from wind, loss from flow Equilibrium line: Accumulation = Ablation
2010 was an exceptional year for Greenland’s ice cap. Melting started early and stretched later in the year than usual. Little snow fell to replenish the losses. By the end of the season, much of southern Greenland had set a new record, with melting that lasted 50 days longer than average.
350 Gt – 1 mm sea level rise Both Antarctica and Greenland have been losing ice over the past 8 years.
Side view Ice flow speed increase with distance above ground
top Top view: Ice flow increases with distance from valley walls.
Basal melt can provide a lubricant to increase total ice flow.
Air bubbles trapped in ice can reveal atmospheric composition in the past (up to about 600,000 yrs).
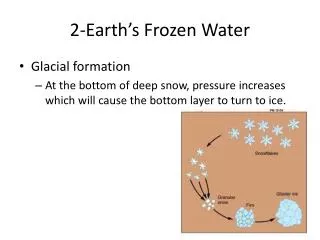
Sublimation or calving • When accumulation is greater than ablation in a certain zone the ice sheet : • Grows • Shrinks • Stays the same size
Sublimation or calving • When accumulation is greater than ablation in a certain zone the ice sheet : • Grows • Shrinks • Stays the same size
Sea Ice What happens to the water level when the ice melts? a. Overflows b. Goes down c. Stays the same
Sea Ice What happens to the water level when the ice melts? a. Overflows b. Goes down c. Stays the same
From: http://earthobservatory.nasa.gov/Features/WorldOfChange/sea_ice.php The yellow outline on each image shows the median sea ice extent observed by satellite sensors in September and March from 1979 through 2000.
From: http://earthobservatory.nasa.gov/Features/WorldOfChange/sea_ice_south.php
Average September Arctic Sea ice decreased by about 40 % • From 1980 to 2010. • Sept 2012 had the lowest Arctic sea ice coverage since 1979.