Download
1 / 8
80 likes | 95 Views
This paper discusses the implementation and advantages of a GIS-enabled desktop application for census results in Morocco, presented at the United Nations Regional Seminar. The application includes features such as thematic maps, query options, census profiles, graphs, and integrated metadata.

E N D
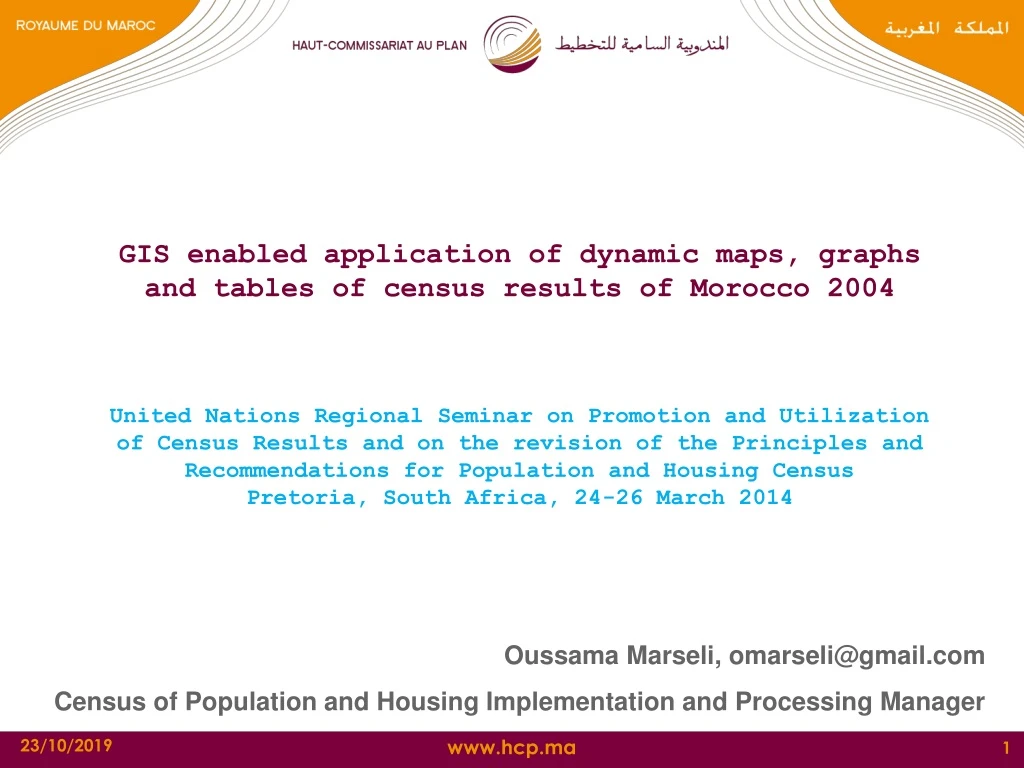
GIS enabled application of dynamic maps, graphs and tables of census results of Morocco 2004 United Nations Regional Seminar on Promotion and Utilization of Census Results and on the revision of the Principles and Recommendations for Population and Housing Census Pretoria, South Africa, 24-26 March 2014 Oussama Marseli, omarseli@gmail.com Census of Population and Housing Implementation and Processing Manager
Advantages • GIS-enabled desktop applications offer some advantages over web applications. Aside from being independent to internet connection, desktop applications come with GIS maps. • Graphical users interface offers to “simple” users the possibility to query maps, tables, graphs for all geographic areas.
Graphical user interface Graphical user interface is the most important layer in a dissemination application. The interface must be simple to use, yet have rich features. This graphical user interface requires no more than two clicks to get thematic maps, detail census profiles, and charts. The first click is to choose the tool (i.e., profile, chart or map). The second click on the desired location is to get census information on the desired format.
Thematic maps This figure shows two drop-down menus, which users can use to select themes and indicators. A thematic map is obtained instantly for the chosen indicator. The map shows any user-defined geographical level by simply activating or deactivating layers of geographical levels (i.e., subdivision 1 (region), subdivision 2 (province), subdivision 3 (commune)).
Query Users can also query this map against any indicator that is already selected, by simply choosing an operator sign (e.g., <, >, =) and keying in criteria. This figure shows an example of a query that highlights communes with poverty rates higher than 60 percent.
Profile If users are interested in a specific area and want to get detailed information about it, they can simply click on the profile tool and then click on the map to generate census profile .
Graphs Maps are useful tools in showing geo-spatial trends, but they often have the limitation of displaying only one indicator at once. In order to analyze the relationship between variables, a display of crossed variables is achieved through a graphical chart . In this case, literary rate by age groups are shown. Again, the query of this graph requires only one click on the graph tool and a second click on the area of interest.
Metadata This figure shows an example of integration of metadata with the underlying data. Here, we only need a click on “button D” (for definition) to obtain a pop-up of the definition of the underlying indicator. The metadata need to be completely integrated so that users will always be able to quickly associate the data they are looking at with definitions of those data.