Download
1 / 28
730 likes | 2.54k Views
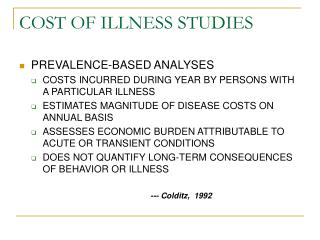
COST OF ILLNESS STUDIES. PREVALENCE-BASED ANALYSES COSTS INCURRED DURING YEAR BY PERSONS WITH A PARTICULAR ILLNESS ESTIMATES MAGNITUDE OF DISEASE COSTS ON ANNUAL BASIS ASSESSES ECONOMIC BURDEN ATTRIBUTABLE TO ACUTE OR TRANSIENT CONDITIONS

E N D
COST OF ILLNESS STUDIES • PREVALENCE-BASED ANALYSES • COSTS INCURRED DURING YEAR BY PERSONS WITH A PARTICULAR ILLNESS • ESTIMATES MAGNITUDE OF DISEASE COSTS ON ANNUAL BASIS • ASSESSES ECONOMIC BURDEN ATTRIBUTABLE TO ACUTE OR TRANSIENT CONDITIONS • DOES NOT QUANTIFY LONG-TERM CONSEQUENCES OF BEHAVIOR OR ILLNESS --- Colditz, 1992
INCIDENCE-BASED ANALYSES • REQUIRES RELIABLE ESTIMATES OF THE INCIDENCE OF DISEASE ATTRIBUTABLE TO OBESITY AT EACH AGE AND FOR EACH GENDER • CAN PROVIDE ESTIMATES FOR THE LIFETIME COST OF OBESITY • - -- Colditz, 1992
ECONOMIC COSTS • DIRECT COSTS • VALUE OF RESOURCES • PERSONAL HEALTH CARE, HOSPITAL CARE, PROFESSIONAL SERVICES, MEDICATIONS) • INDIRECT COSTS • VALUE OF LOST OUTPUT DUE TO MORBIDITY (WAGES LOST)OR MORTALITY (VALUE OF FUTURE EARNINGS LOST) • --- Colditz, 1992
ECONOMIC COST OF OBESITY • NIDMM -11.5 BILLION • GALL BLADDER DISEASE 2.4 BILLION • CVD (EXCLUDING HTN) 22.2 BILLION • HTN 1.5 BILLION • CANCER 1.9 BILLION • TOTAL COST = $39.3 BILLION OR 5.5% OF TOTAL COSTS OF ILLNESS IN 1986 • ----Colditz, 1992
REVISED ESTIMATE OF COST BY INCLUDING MUSCULOSKELETAL DISEASES (1990)DIRECT COST OF TREATING OBESITY IN THE US IS $45.8 BILLION OR 6% OF THE TOTAL EXPENDITURE OF HEALTH CARE IN US---Wolf and Colditz, 1994
UK Cost of treating obesity in UK estimated at 195 million pounds ---West, 1994
UK (2002) • Cost of obesity (BMI greater than 30) was around 3340-3724 million pounds • If costs of being overweight are included (BMI 25-30) then the total annual cost of obesity and overweight would be around 6.6- 7.4 billion pounds • 2.3- 2.6% of total net National Health Service expenditure in 2001-2002
UK 2002 (continued) • Lost earnings 2350-2600 million pounds • 34,000 deaths annually attributable to obesity • Probability of being in employment is significantly lower (up to 25%) for obese compared to those of normal weight • Obese may be discriminated in labor market • Obese may earn less and have lower education • -----McCormick et al, 2006
HEALTH CARE COSTS OF OBESITY IN NEW ZEALAND • ANALYSIS USING SAME ILLNESSES (NIDDM, CHD, HTN, GALLSTONE DISEASE, BREAST AND COLON CANCER) • NZ$135MILLION OR 2.5% OF TOTAL HEALTH CARE COSTS 1991 • ----Swinburn et al., 1997
STUDIES USING POPULATION ATTRIBUTABLE FRACTIONSPAF = PRODUCT OF RELATIVE RISK AND PREVALENCE RISK FACTORTHE PAF CAN BE USED TO CACULATE THE DIRECT COST OF TREATING OBESITY
STUDIES UTILIZING POPULATION ATTRIBUTABLE FRACTIONS • PAF CAN BE CALCULATED TO ESTIMATE DIRECT COST OF TREATING co-morbidities • Segal et al., 1994 (Australia) $A395 million • Levy et al., 1995 (France, 1990) FFr12 billion or 2% of the French health care costs • Seidell, 1995 (Netherlands) overweigt and obesity account for 4% of the total Dutch health care costs • ---Hughes and McGuire, 1997
BODY MASS AND HEALTH CARE EXPENDITURES • MEDSTAT STUDY OF 16,217 INDIVIDUALS, 18-65 • NATIONAL MEDICAL EXPENDITURE SURVEY DATA • USE OF ANY HEALTH CAR SERVICE AND EXPENDITURES • USE OF INPATIENT SERVICES AND EXPENDITURES • USE OF OUTPATIENT SERVICES AND EXPENDITURES • USE OF PRESCRIPTION MEDS AND EXPENDITURES • ---Heithoff et al., 1997
STRONG RELATIONSHIPS BETWEEN BODY MASS AND THE LIKELIHOOD OF USING HEALTH CARE SERVICES AND EXPENDITURES • ASSOCIATION WAS GREATER AMONG MALES • IDEAL BODY MASS WAS ASSOCIATED WITH 6.3% TO 36.1% LOWER ANNUAL HEALTH CARE EXPENDITURES (FEMALES) AND 3.6 TO 18.2% LOWERE EXPENDITURES IN MALES ---Heithoff et al, 1997
CONCLUSION • Health care expenditures increase as weight deviates from the ideal • Increased expenditures and BMI relates to association of body mass to chronic illness especially diabetes and HTN ---Heithoff et al, 1997
IMPACT OF OBESITY AND OVERWEIGHT IN JAPAN • U-SHAPED ASSOCIATION BETWEEN BMI AND TOTAL MEDICAL COSTS • MEAN TOTAL COSTS WERE 9.8% GREATER AMONG THE OVERWEIGHT • STATISTICALLY INCREASED MORTALITY RISK IN OBESE WOMEN AND LEAN MEN AND WOMEN • STATISTICALLY SIG RELATIONSHIP BETWEEN EXCESS WEIGHT AND INCREASED RISK IN WOMEN OF ALL CANCERS • ----Kuriyama, et al., 2006
HEALTH CARE COSTS OF OBESITY IN NEW ZEALAND • ANALYSIS USING SAME ILLNESSES (NIDDM, CHD, HTN, GALLSTONE DISEASE, BREAST AND COLON CANCER) • NZ$135MILLION OR 2.5% OF TOTAL HEALTH CARE COSTS 1991 • ----Swinburn et al., 1997
INDIRECT COSTS • Colditz --indirect cost from lost productivity $20 billion for US in 1986 and $23 billion in updated study • Sjostrom et al., 1992--- level of sicknees absence was 1.4-2.4 times higher in obese individuals and number on disability pension 1.5-2.8 times higher (survey data) • Whole Swedish population--- 7% total productivity loss due to obesity • -----Hughes and McGuire, 1997
COST OF OBESITY MODEL • PATIENT CHARACTERISTICS (AGE, SEX, BMI) • Stage 1 • CARDIOVASCULAR RISK PROFILE (HTN, HYPERCHOLESTEROLEMIA, TYPE II DIABETES)---management ($) • Stage 2 • CARDIOVASCULAR DISEASE (CHD, STROKE) ----treatment of CHD, STROKE($) ---Thompson et al., 1999
Inflation-Adjusted Obesity Attributable Increase in Per Capita Health Care Spending1987-2001 • Obesity accounted for 27 percent of the growth in real per capita spending between 1987 and 2001 • Prevalence of obesity increased by 10.3 percentage points—to nearly 24 percent of the adult population • Costs incurred by obese were 37 percent higher than costs for those with normal weight • ---Thorpe, et al., 2004
HEALTH EXPENDITURES IN OVERWEIGHT AND OBESE CHILDREN • Retrospective study • Used claims data from a large pediatric delivery system • Urban academic children’s hospital • Outcome measures: Dx obesity, primary care visits, ER, lab use, health care charges ---Hampl, et al, 2007
HEALTH EXPENDITURES IN OVERWEIGHT AND OBESE CHILDREN (continued) • Overweight and obese children and adolescents have significantly more lab eval and higher charges
GLOBAL EPIDEMICS OF OBESITY AND DIABETES • 7 OF 10 OF THE COUNTRIES WITH THE GREATEST NUMBER OF DIABETICS ARE IN THE GLOBAL SOUTH • WITHIN THE NEXT TWO DECADES, THE NUMBER OF PESONS LIIVING WITH DIABETES IN BRAZIL, CHINA AND INDIA IS PROJECTED TO INCREASE AT NEARLY TWICE THE RATE OBSERVED IN THE US • GREATER INCIDENCE AT EARLIER STAGES OF LIFE • NEARLY ONE OUT OF EVERY THREE HOSPITAL BED-DAYS IN LATIN AMERICA ARE OCCUPIED FOR DIABETES-RELATED CAUSES • ---Yach, Stuckler and Brownell, 2006
GLOBAL EPIDEMICS OF OBESITY AND DIABETES (continued) • Diabetics in India: 15-25% of household income is required to cover treatment costs • Tanzania: costs amount to 25% of minimum wage or 20 times the per capita health expenditure • China: 30% of poor households attributed their poverty to healthcare costs ---Yach, Stuckler and Brownell, 2006
DISCUSSION OF LIMITATIONS OF COST-OF-ILLNESS STUDIES • “Economics and Obesity: Costing the Problem or Evaluating Solutions” • Larissa Roux and Cam Donaldson Obesity Research v 12 no. 2 February 2004