
Programming Assignment 3
E N D
Presentation Transcript
Programming Assignment 3 CS 302 - Data Structures Dr. George Bebis
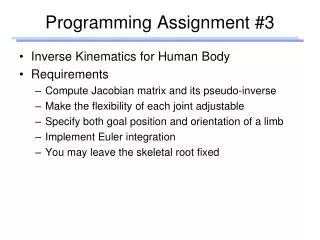
Goal: Represent image regions using lists and perform galaxy classification • Builds on previous two programming assignments. (1) Represent image regions in a list for easier processing. (2) Compute region features.
Project Objectives • Improve your skills with manipulating unsorted/sortedlists • Improve your skills with using templates • Learn about feature extractionandclassification.
Region Features • Image regions can be characterized using various features: • Geometric • Photometric
Geometric Features • The geometry of a region can be characterized using: • Size • Position • Orientation • Shape (e.g., circular, elliptical) • Many of these features could be computed using a family of functions called moments.
Moments • The moments of order (p,q) of a region R are: (i,j) є R • Note:moments have their roots in probability theory and are • used to characterize probability density functions (pdfs). • - Mean (i.e., first order moment) • - Variance (i.e., second order central moments).
Region Area (i.e., size) • The area of a region is defined by the number of pixels in the region (i.e., size). • Can be computed using zero order moments (i.e., p=q=0) : (i,j) є R
Region Center (i.e., centroid) • The centroid of a region (i.e., center coordinates) can be computed using first order moments (p=1 or q=1):
Central Moments • To make region descriptors invariant with respect to location, moments can be calculated with respect to the centroid of the region (i.e., central moments):
Principal Axes • The principal axes of a region can be used to characterize the • shape and orientation of a region. Amin and Amax
Principal Axes (cont’d) • The principal axes, Amin and Amax, of a region can be computed using the principal moments λmin, λmax: • The principal momentsinvolve first and second order central moments:
Region Orientation • The direction of the largest principal axis can be used to specify the orientation of a region:
Region Eccentricity (i.e., Elongatedness) • A useful measure of a region’s circularity is its eccentricity (i.e., elongatedness). • Can be easily computed using the ratio between the principal axes:
Photometric Properties • Measures characterizing region intensity, for example: • Mean and median of the gray-levels. • Minimum and maximum intensity values.
Object Classification - Example • Objects could be classified in different categories using various region properties, for example: • Large/Small/Medium • Elongated/Circular
Geometric properties Intensity properties List of pixels Geometric properties Intensity properties List of pixels Geometric properties Intensity properties List of pixels … x,y x,y x,y x,y x,y x,y x,y x,y x,y Represent regions in a sorted list: listOfRegions • Nodes store info about each region (i.e., “RegionType”) • Sub-lists store the coordinates of pixels in each region • - i.e., “PixelType” -- unsorted listOfRegion: sorted with respect to “size” listOfPixels: unsorted
Geometric properties Intensity properties List of pixels x,y x,y x,y you need to define them! Extra credit: template lists This is object composition! template<class ItemType> struct NodeType { ItemType info; NodeType<ItemType>* next; }; listOfRegions: ItemType should be “RegionType” listOfPixels: ItemType should be “PixelType”
Extend computeComponents • computeComponents should return the following info: • the labeled image (same as before) • the number of regions (same as before) • a list of regions (new) • Modify BFS or DFS • Use one of them in this assignment int computeComponents(inputImage, outputImage, listOfRegions)
(client function) int computeComponents(inputImage, outputImage, listOfRegions) outputImage --> white connComp=0; for (i=0; i<N; i++) for(j=0; j<M; j++) if(inputImage[i][j] == 255 && outputImage[i][j]==255) { ++connComp; label = connComp; findComponentDFS(inputImage, outputImage, i, j, label, region); // or findComponentBFS(inputImage, outputImage, i, j, label,region); INSERT region into “listOfRegions” } return connComp; type “RegionType”
Geometric properties Intensity properties List of pixels x,y x,y x,y typeRegionType findComponentDFS(inputImage, outputImage, i, j, label, region) Stack.MakeEmpty(); Stack.Push((i,j)); // initialize stack while(!Stack.IsEmpty()) { Stack.Pop((pi,pj)); INSERT (pi,pj) into “listOfPixels” of “region” outputImage[pi][pj] = label * 10; for each neighbor (ni,nj) of (pi,pj) // push neighbors if(inputImage[ni][nj] == 255 && outputImage[ni][nj] == 255) { outputImage[ni][nj] = -1; // mark this pixel Stack.Push((ni,nj)); } } COMPUTE geometric and photometric properties and populate “region”
(client function) void deleteSmallComponents(listOfRegions, threshold) • Step through the list nodes and delete all the regions whose size is less than a user-specified threshold (e.g., 20-30 pixels). “deleteSmallComponents” will be useful for debugging your program (i.e., keep large regions only) • Hint: You would not have to visit all the nodes since the list • will be sorted from the smallest to the largest region!
Classify regions • Add a new option in the driver called “classify regions” • Given an input image (i.e., from Image Gallery 2), your program should extract and represent the regions as described. • Prints a summary of the regions found and their properties (e.g., position, size, orientation, eccentricity, mean intensity etc.) • Prints min/max values of size, eccentricity, and mean intensity.
Classify regions (cont’d) • Then, your program should print the following sub-menu: (1) display regions with size between values A and B (2) display regions with orientation between values A and B (3) display regions with eccentricity between A and B (4) display regions with mean intensity between A and B (5) back to the main menu
Geometric properties Intensity properties List of pixels Geometric properties Intensity properties List of pixels Geometric properties Intensity properties List of pixels … x,y x,y x,y x,y x,y x,y x,y x,y x,y Display your results • Traverse listOfRegions • Find the nodes satisfying the constraint chosen by the user • For each such node, traverse its listOfPixels • For each pixel, copy its original value in a new image • Display the resulted image! Example: original image output image