SGLT2 Inhibitors: Mechanism and Effects on Glucose Homeostasis
150 likes | 165 Views
This article explores the rationale behind SGLT2 inhibitors in managing type 2 diabetes by inhibiting glucose reabsorption in the kidney, leading to glucosuria and improved glucose control. The mechanism, pathophysiology, and effects on insulin sensitivity and β-cell function are detailed with relevant studies and results provided.

SGLT2 Inhibitors: Mechanism and Effects on Glucose Homeostasis
E N D
Presentation Transcript
Rationale for SGLT2 Inhibitors • Inhibit glucose reabsorption in the renal proximal tubule • Resultant glucosuria leads to a decline in plasma glucose and reversal of glucotoxicity • This therapy is simple and nonspecific • Even patients with refractory type 2 diabetes are likely to respond
Pathophysiology of Type 2 Diabetes Impaired Insulin Secretion Insulin Resistance Increased HGP Islet b-cell Glucosuria 10 mmol/L FastingPlasma Glucose
Pathophysiology of Type 2 Diabetes Impaired Insulin Secretion Insulin Resistance Increased HGP 10 mmol/L 5 mmol/L Islet b-cell Glucosuria FastingPlasma Glucose
Renal Handling of Glucose (180 L/day) (900 mg/L)=162 g/day Glucose SGLT2 S1 SGLT1 S3 90% 10% No Glucose
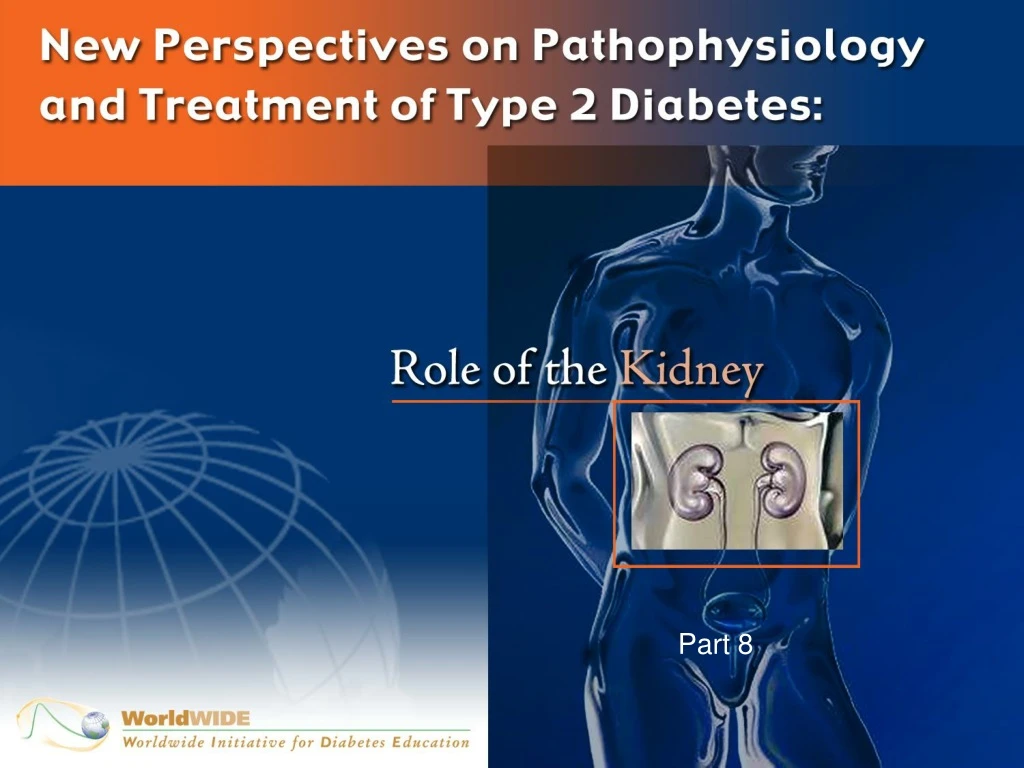
SGLT2 Mediates GlucoseReabsorption in the Kidney K+ ATPase Na+ SGLT2 GLUT2 Glucose Glucose Lumen Blood S1 Proximal Tubule Na+ • Major transporter of glucose in the kidney • Low affinity, high capacity for glucose • Nearly exclusively expressed in the kidney • Responsible for ~90% of renal glucose reabsorption in the proximal tubule Hediger MA, Rhoads DB. Physiol. Rev. 1994;74:993-1026.
Renal Glucose Handling TmG Splay Glucose Reabsorptionand Excretion Reabsorption Excretion Theoretical threshold Actual Threshold 5 10 15 Plasma Glucose Concentration (mmol/L)
Effect of Phlorizin on Insulin Sensitivity in Diabetic Rats: Study Design • Phlorizin treatment period: 4-5 weeks • Diet was same for all groups; body weight was similar across groups at end of study Rossetti L, et al. J Clin Invest. 1987;79:1510-1515.
Effect of Phlorizin on Fed and Fasting Plasma Glucose in Diabetic Rats † 8 20 * † 15 6 Fasting Glucose (mmol/L) 4 10 Fed Glucose (mmol/L) 2 5 0 0 Control Diabetes Control Diabetes + Phlorizin Diabetes Diabetes + Phlorizin Diabetes +/- Phlorizin Diabetes +/- Phlorizin *P<0.05 vs control and phlorizin. †P<0.001 vs control and phlorizin. Rossetti L, et al. J Clin Invest. 1987;79:1510-1515.
Insulin-Mediated Glucose Uptake in DiabeticRats Following Phlorizin Treatment 40 35 30 * * 25 20 Diabetes+/- Phlorizin Control Diabetes Diabetes+ Phlorizin Glucose Uptake(mg/kg ∙ min) *P<0.001 vs control and phlorizin. Rossetti L, et al. J Clin Invest. 1987;79:1510-1515.
Mechanism of Action of SGLT2 Inhibitors Inhibition of SGLT2 Reversal of glucotoxicity • Insulin sensitivity in muscle • ↑ GLUT4 translocation • ↑Insulin signaling • Other • Insulin sensitivity in liver • ↓ Glucose- 6-phosphatase • Gluconeogenesis • Decreased Cori cycle • ↓ PEP carboxykinase -Cell function
Effect of Phlorizin on -Cell Functionin Diabetic Rats: Study Design • Sprague-Dawley male rats weighing 80-100 g • Phlorizin treatment period: 3 weeks • Arginine clamp (2 mM); hyperglycemic clamp (≥5.5 mmol/L) Rossetti L, et al. J Clin Invest. 1987;80:1037-1044.
Plasma Insulin Response to Glucose First Phase Second Phase 6 4 Plasma Insulin (ng/mL ∙ min / g Pancreas) * 2 * 0 Control Diabetes Diabetes+ Phlorizin Control Diabetes Diabetes+ Phlorizin *P<0.001 vs control. Rossetti L, et al. J Clin Invest. 1987;80:1037-1044.
Plasma Glucagon Concentration in DiabeticDogs Before and After Phlorizin Glucose Infusion Rate (mg/kg • min) 2 6 8 12 16 24 0 Diabetic Glucagon (pg/mL) -200 Diabetic +Phlorizin -400 Starke A, et al. Proc Natl Acad Sci. 1985;82:1544-1546.