Exploring Quadratic Graphs
Exploring Quadratic Graphs. Objective: To graph quadratic functions. Parabola. The graph of any quadratic function. It is a kind of curve. Where are parabolas seen in the real world?. The Arctic Poppy. Satellite Dishes. The Golden Gate Bridge. Trajectory. Headlights.

Exploring Quadratic Graphs
E N D
Presentation Transcript
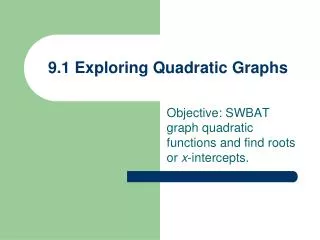
Exploring Quadratic Graphs Objective: To graph quadraticfunctions.
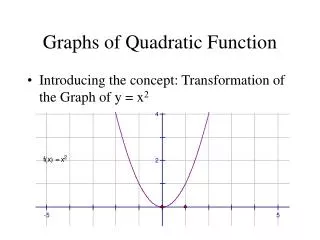
Parabola The graph of any quadratic function. It is a kind of curve.
Where are parabolas seen in the real world? The Arctic Poppy Satellite Dishes The Golden Gate Bridge Trajectory Headlights
Why is the parabola important? • Suspension Bridges use a parabolic design to evenly distribute the weight of the entire bridge to the supporting columns.
Why is the parabola important? • The Satellite Dish uses a parabolic shape to ensure that no matter where on the dish surface the satellite signal strikes, it is always reflected to the receiver.
Why is the parabola important? A car’s Headlights, and common flashlights, use parabolic mirrors to project the light from the bulb into a tight beam, directing the light straight out from the car, or flashlight.
Standard Form y = ax2 + bx + c Examples http://www.mathwarehouse.com/quadratic/parabola/interactive-parabola.php or http://www-groups.dcs.st-and.ac.uk/~history/Java/Parabola.html
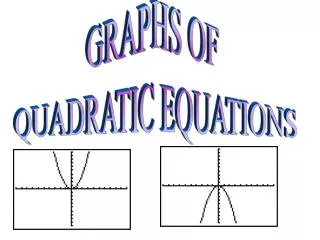
y = ax2 + bx + c Positive “a” values mean the parabola will open upwards and will have a minimum. point Minimum point is also called a vertex.
y = -ax2 + bx + c Negative “a” values mean the parabola will open downwards and will have a maximum point Maximum point is also called a vertex.
Steps 1. Draw a table and insert vertex of (0,0). 2. Choose two numbers greater than the x coordinate and two numbers less. 3. Solve for Y Graph
x y –2 –11 –1 –2 0 1 1 –2 2 –11 Check It Out! Example 2b Graph the quadratic function. y = –3x2 + 1 Make a table of values. Choose values of x and use them to find values of y. Graph the points. Then connect the points with a smooth curve.
x y –2 6 –1 3 0 2 1 3 2 6 Check It Out! Example 2a Graph each quadratic function. y = x2 + 2 Make a table of values. Choose values of x and use them to find values of y. Graph the points. Then connect the points with a smooth curve.
Write the function in the form y = ax2 + bx + c by solving for y. Add to both sides. Additional Example 3A: Identifying the Direction of a Parabola Tell whether the graph of the quadratic function opens upward or downward. Explain. Identify the value of a. Since a> 0, the parabola opens upward.
Additional Example 3B: Identifying the Direction of a Parabola Tell whether the graph of the quadratic function opens upward or downward. Explain. y = 5x– 3x2 Write the function in the form y = ax2 + bx + c. y = –3x2 + 5x a = –3 Identify the value of a. Since a< 0, the parabola opens downward.
Check It Out! Example 3a Tell whether the graph of each quadratic function opens upward or downward. Explain. f(x) = –4x2 – x + 1 f(x) = –4x2 – x + 1 Identify the value of a. a = –4 Since a < 0 the parabola opens downward.
Lesson Quiz: Part I 1. Without graphing, tell whether (3, 12) is on the graph of y = 2x2 – 5. 2. Graph y = 1.5x2. no
Lesson Quiz: Part II Use the graph for Problems 3-5. 3. Identify the vertex. 4. Does the function have a minimum or maximum? What is it? 5. Find the domain and range. (5, –4) maximum; –4 D: all real numbers; R: y ≤ –4