Download
1 / 24
240 likes | 572 Views
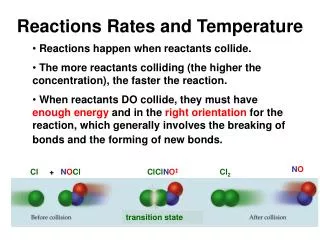
Rates and orders of reactions. Rate Constant. The order of a reaction refers to the way in which the concentration of drug or reactants influences the rate of a chemical reaction or process. Zero-Order Reactions First-Order Reactions. Zero-Order Reactions.

E N D
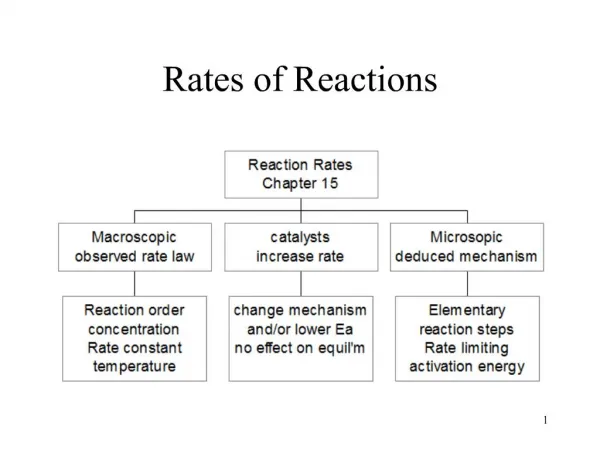
Rate Constant • The order of a reaction refers to the way in which the concentration of drug or reactants influences the rate of a chemical reaction or process. • Zero-Order Reactions • First-Order Reactions
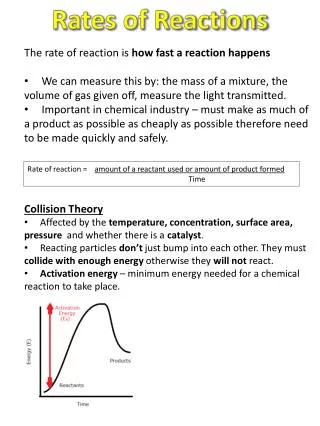
Zero-Order Reactions • a graph of A versus t yields a straight line. • The yintercept is equal to A0 • The slope of the line is equal to k0. • Equation above may be expressed in terms of drug concentration, which can be measured directly. • C0 is the drug concentration at time 0 • C is the drug concentration at time t. • k0 is the zero-order decomposition constant.
First-Order Reactions • Equation may also be expressed as: • Because ln = 2.3 log, Equation becomes:
First-Order Reactions • When drug decomposition involves a solution, starting with initial concentration C0, it is often convenient to express the rate of change in drug decomposition, dC/dt, in terms of drug concentration, C, rather than amount because drug concentration is assayed. Hence,
First-Order Reactions • a graph of log A versus t will yield a straight line . • The y intercept will be log A0 • The slope of the line will be –k/2.3 . • Similarly, a graph of log C versus t will yield a straight line. The y intercept will be log C0, and the slope of the line will be –k/2.3.
First-Order Reactions • C versus t may be plotted on semilog paper without the need to convert C to log C. An example is shown:
Half-Life • Half-life (t1/2) expresses the period of time required for the amount or concentration of a drug to decrease by one-half.
Zero-Order Half-Life • The t1/2 for a zero-order process is not constant. The zero-order t1/2 is proportional to the initial amount or concentration of the drug and is inversely proportional to the zero-order rate constant k0:
First-Order Half-Life • The t1/2 for a first-order reaction may be found by means of the following equation: • t1/2 is a constant. No matter what the initial amount or concentration of drug is, the time required for the amount to decrease by one-half is a constant.
Example • A pharmacist weighs exactly 10 g of a drug and dissolves it in 100 mL of water. The solution is kept at room temperature, and samples are removed periodically and assayed for the drug. The pharmacist obtains the following data:
From these data, a graph constructed by plotting the concentration of drug versus time will yield a straight line. Therefore, the rate of decline in drug concentration is of zero order. • The zero-order rate constant k0 may be obtained from the slope of the line or by proper substitution into Equation . • If Co=conc. Of 100mg/ml at t = 0 • And C = conc. Of 90mg/ml at t = 4hr • Then 90 = -k0 (4) + 100 K0 = 2.5mg/ml hr
Example 1 • A pharmacist dissolves exactly 10 g of a drug into 100 mL of water. The solution is kept at room temperature, and samples are removed periodically and assayed for the drug. The pharmacist obtains the following data:
The relationship of time versus drug concentration in indicates a first-order reaction. • The t1/2 for a first-order process is constant and may be obtained from any two points on the graph that show a 50% decline in drug concentration. • In this example, the t1/2 is 4 hours. The first-order rate constant may be found by: • obtaining the product of 2.3 times the slope. • by dividing 0.693 by the t1/2, as follows:
Example 2 • Plot the following data on both semilog graph paper and standard rectangular coordinates. • Does the decrease in the amount of drug A appear to be a zero-order or a first-order process? • What is the rate constant k? • What is the half-life t1/2? • Does the amount of drug A extrapolate to zero on the x axis? • What is the equation for the line produced on the graph?
Zero-order process . • Rate constant, k0:
Example 3 Plot the following data on both semilog graph paper and standard rectangular coordinates. Answer questions a, b, c, d, and e as stated in Question 1.
First-order process. • Rate constant, k:
Homework • A pharmacist dissolved a few milligrams of a new antibiotic drug into exactly 100 mL of distilled water and placed the solution in a refrigerator (5°C). At various time intervals, the pharmacist removed a 10-mL aliquot from the solution and measured the amount of drug contained in each aliquot. The following data were obtained.
Is the decomposition of this antibiotic a first-order or a zero-order process? • What is the rate of decomposition of this antibiotic? • How many milligrams of antibiotics were in the original solution prepared by the pharmacist? • Give the equation for the line that best fits the experimental data.