Download
1 / 30
300 likes | 318 Views
This lecture review covers the life cycle of thunderstorms, lightning strokes, and the development and characteristics of hurricanes. It also includes information about Hurricane Sandy and its potential hazards. Due dates for the midterm and research paper/video presentation are provided.

E N D
Lecture 8 10/29/12 • Review Last Lecture • CH 11 Hurricanes • Hurricane Sandy! • Review Mid Term • Video Dessert: Infrared satellite imagery for the west coast of the US at 4 different scales • Due Dates: • Mid Term III 11/19/12 • CH 6-11 • Lecture 7-10 • Research Paper/Video Presentation 11/26/12
REVIEW SLIDES: Simplified model depicting the life cycle of an ordinary thunderstorm that is nearly stationary. (Arrows show vertical air currents. Dashed line represents freezing level, 0°C isotherm.)
REVIEW SLIDES: A simplified model describing air motions and other features associated with an intense multicell thunderstorm that has a tilted updraft. The severity depends on the intensity of the storm’s circulation pattern. http://www.youtube.com/watch?v=bOfOA3PTghM&feature=related Thunderstorms Video
REVIEW SLIDES: The generalized charge distribution in a mature thunderstorm.
REVIEW SLIDES: The development of a lightning stroke. (a) When the negative charge near the bottom of the cloud becomes large enough to overcome the air’s resistance, a flow of electrons — the stepped leader — rushes toward the earth. (b) As the electrons approach the ground, a region of positive charge moves up into the air through any conducting object, such as trees, buildings, and even humans. (c) When the downward flow of electrons meets the upward surge of positive charge, a strong electric current — a bright return stroke — carries positive charge upward into the cloud.
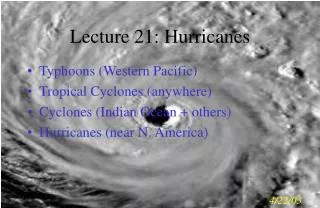
Hurricanes Intense storm of tropical origin with winds greater than 64 kts; typhoon, cyclone, tropical cyclone Eye Eyewall Spiral rain band Anticyclonic divergence Latent heat Chapter 11
Hurricane Elena over the Gulf of Mexico about 130 km (80 mi) southwest of Apalachicola, Florida, as photographed from the space shuttle Discovery during September, 1985. Because this storm is situated north of the equator, surface winds are blowing counterclockwise about its center (eye). The central pressure of the storm is 955 mb, with sustained winds of 105 knots (121 mi/hr) near its eye.
intensifying tropical cyclone air pressure drops rapidly as you approach the eye of the storm surface winds normally reach maximum strength in the region of the eyewall
A model that shows a vertical view of air motions and clouds in a typical hurricane in the Northern Hemisphere. The diagram is exaggerated in the vertical.
The cloud mass is Hurricane Katrina’s eyewall, and the clear area is Katrina’s eye photographed inside the eye on August 28, 2005, from a NOAA reconnaissance (hurricane hunter) aircraft.
Hurricane Katrina in 3-D The cutaway view shows concentric bands of heavy rain (red areas inside the clouds) encircling the eye. Notice that the heaviest rain (largest red area) occurs in the eyewall. The isolated tall cloud tower (in red) in the northern section of the eyewall indicates a cloud top of 16 km (52,000 ft) above the ocean surface. Such tall clouds in the eyewall often indicate that the storm is intensifying.
Hurricane Formation and Dissipation • Why Does The Storm Die Out? • Cold water, land • Hurricane Stages of Development: • Tropical Disturbance • Tropical Depression (22-34kts) • Tropical Storm (35-64kts) • Hurricane (>65kts)
Visible satellite image showing four tropical systems, each in a different stage of development.
A hurricane moving northward will have higher sustained winds on its eastern side than on its western side. The boxed area represents the region of strongest winds.
The total number of hurricanes and tropical storms (red shade) and hurricanes only (yellow shade) that have formed during the past 100 years in the Atlantic Basin—the Atlantic Ocean, the Caribbean Sea, and the Gulf of Mexico. (NOAA)
Regions where tropical storms form (orange shading), the names given to storms, and the typical paths they take (red arrows).
Hurricane Sandy • Video of Infrared imagery of Hurricane Sandy from the National Weather Service • east_coast_IR_20121028_1700.avi • Forecasts • Hazards (wind, rain, storm surge, flooding) • River Gages: http://water.weather.gov/ahps2/index.php?wfo=akq
National Hurricane Center (NHC) satellite imagery Sunday 10/28/12
These graphics show probabilities of sustained (1-minute average) surface wind speeds equal to or exceeding 34 kt...39 mph (tropical storm force). These wind speed probability graphics are based on the official National Hurricane Center (NHC) track, intensity, and wind radii forecasts, and on NHC forecast error statistics for those forecast variables during recent years.
This is the forecast for rainfall from Hurricane Sandy after 120 hours.
This shows the overall chance that storm surges will be greater than 2 feet above normal tide levels during the 3 days after 10/28/12. The graphic is based upon an ensemble of Sea, Lake, and Overland Surges from Hurricanes (SLOSH) model runs created using the current National Hurricane Center (NHC) official hurricane advisory. Storm surge probabilities depend on the historical accuracy of NHC's forecasts of hurricane track, and wind speed, and an estimate of storm size. http://www.nhc.noaa.gov/refresh/graphics_at3+shtml/205341.shtml?gm_psurge#contents
This shows the overall chance that storm surges will be greater than 6 feet above normal tide levels during the 3 days after 10/28/12. http://www.nhc.noaa.gov/refresh/graphics_at3+shtml/205341.shtml?gm_psurge#contents
Projected Measured
BONUS SLIDE http://www.nhc.noaa.gov/text/refresh/MIATCPAT3+shtml/290247.shtml Example: DISCUSSION AND 48-HOUR OUTLOOK ------------------------------ AT 1100 PM EDT...0300 UTC...THE CENTER OF HURRICANE SANDY WAS LOCATED NEAR LATITUDE 34.5 NORTH...LONGITUDE 70.5 WEST. SANDY IS MOVING TOWARD THE NORTHEAST NEAR 14 MPH...22 KM/H. A TURN TOWARD THE NORTH IS EXPECTED DURING THE NEXT SEVERAL HOURS...WITH A TURN TOWARD THE NORTHWEST EXPECTED ON MONDAY. ON THE FORECAST TRACK... THE CENTER OF SANDY WILL MOVE OVER THE COAST OF THE MID-ATLANTIC STATES LATE MONDAY OR MONDAY NIGHT. MAXIMUM SUSTAINED WINDS ARE NEAR 75 MPH...120 KM/H...WITH HIGHER GUSTS. SANDY IS EXPECTED TO TRANSITION INTO A FRONTAL OR WINTERTIME LOW PRESSURE SYSTEM PRIOR TO LANDFALL. HOWEVER...THIS TRANSITION WILL NOT BE ACCOMPANIED BY A WEAKENING OF THE SYSTEM...AND IN FACT...A LITTLE STRENGTHENING IS POSSIBLE DURING THIS PROCESS. SANDY IS EXPECTED TO WEAKEN AFTER MOVING INLAND. HURRICANE FORCE WINDS EXTEND OUTWARD UP TO 175 MILES... 280 KM...MAINLY TO THE SOUTHWEST OF THE CENTER...AND TROPICAL STORM FORCE WINDS EXTEND OUTWARD UP TO 520 MILES...835 KM. A NATIONAL OCEAN SERVICE STATION AT THE WILLOUGHBY DEGAUSSING STATION NEAR NORFOLK NAVAL STATION VIRGINIA RECENTLY REPORTED SUSTAINED WINDS OF 45 MPH...72 KM/H...WITH A GUST TO 53 MPH...85 KM/H. A WEATHERFLOW STATION AT THIMBLE SHOALS VIRGINIA RECENTLY REPORTED SUSTAINED WINDS OF 44 MPH...70 KM/H...AND A WIND GUST OF 52 MPH...83 KM/H. THE MINIMUM CENTRAL PRESSURE BASED ON AIR FORCE RESERVE AND NOAA HURRICANE HUNTER AIRCRAFT DATA IS950 MB...28.05 INCHES.
BONUS SLIDE • Video Dessert: Infrared Satellite Imagery of the west coast of the US at 4 different scales: • pacific_IR_28_km_20121028_1700.avi • pacific_IR_14_km_20121028_1700.avi • pacific_IR_4_km_20121028_1700.avi • pacific_IR_2_km_20121028_1700.avi
BONUS SLIDE This shows storm surge heightin feet, above normal tide levels, such that there is an N percent chance of exceeding it, where N ranges from 10 to 90 in intervals of 10 percent. The 10 percent exceedance height, for example, is the storm surge height, above normal tide levels, such that there is a 10 percent chance of exceeding it. This graphic is based upon an ensemble of Sea, Lake, and Overland Surge from Hurricanes (SLOSH) model runs using the National Hurricane Center (NHC) official advisory and account for track, size, and intensity uncertainty from historical errors. http://www.nhc.noaa.gov/refresh/graphics_at3+shtml/205341.shtml?gm_esurge#contents
BONUS SLIDE A tropical wave (also called an easterly wave) moving offthe coast of Africa over the Atlantic. The wave is shown by the bending of streamlines—lines that show wind flow patterns. (The heavy dashed green line is the axis of the ridge.) The wave moves slowly westward, bringing fair weather on its western side and rain showers on its eastern side.
BONUS SLIDE Hurricane Formation and Dissipation • Hurricane movement • General track: west, northwest, northeast • Topic: Hurricanes and Mid-latitude Storms • Hurricane warm core low • Mid-latitude cold-core low • Arctic hurricanes • Hurricane + upper level trough = mid-latitude cyclone