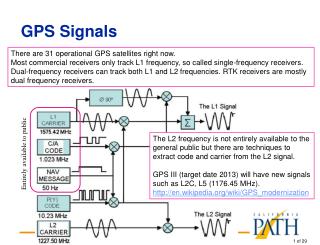
Download
1 / 35
350 likes | 437 Views
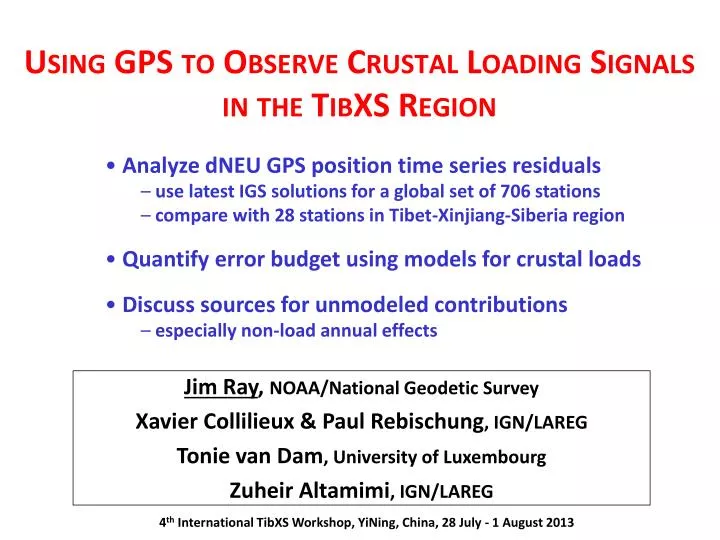
Analyze dNEU GPS position time series residuals use latest IGS solutions for a global set of 706 stations compare with 28 stations in Tibet-Xinjiang-Siberia region Quantify error budget using models for crustal loads Discuss sources for unmodeled contributions

E N D
Analyze dNEU GPS position time series residuals • use latest IGS solutions for a global set of 706 stations • compare with 28 stations in Tibet-Xinjiang-Siberia region • Quantifyerror budget usingmodels for crustalloads • Discuss sources for unmodeled contributions • especially non-load annual effects Using GPS to Observe Crustal Loading Signals in the TibXS Region Jim Ray, NOAA/National Geodetic Survey Xavier Collilieux & Paul Rebischung, IGN/LAREG Tonie van Dam, University of Luxembourg Zuheir Altamimi, IGN/LAREG 4th International TibXS Workshop, YiNing, China, 28 July - 1 August 2013
Modeled Vertical Loading Deformation Signals Atmospheric Pressure (ECMWF-MOG2D) Soil Moisture (GLDAS) Snow (GLDAS) • Crustal loading is large across • central Asia for all major fluid • sources • Height variations canreach 1 cm • at annual periods, mostly • Signatures shouldbeclear in • lGS station position time series (All plots from P. Gegout et al., EGU 2009) 02 RMS (mm)
IGS Stations in Tibet-Xinjiang-Siberia Region NRIL BJFS • 28 stations in TibXS region with >100 weeks of IGS Repro1 results 03
Data Sets to Compare • GPS station position time series from IGS 1st reprocessing • analysis consistent with IERS 2010 Conventions (more or less) • combined weekly frame results from up to 11 Analysis Centers • 706 globally distributed stations, each with >100 weeks • data from 1998.00 to 2011.29 • Helmert alignment (no scale) w.r.t. cumulative solution uses a well-distributed subnetwork to minimize aliasing of local load signals • care taken to find position/velocity discontinuities • Mass load displacement time series for the same stations • 6-hr NCEP atmosphere • 12-hr ECCO non-tidal ocean • monthly GLDAS surface ice/water, cubic detrended to remove model drift • all computed in CF frame • sum is linearly detrended & averaged to middle of each GPS week • data from 1998.0 to 2011.0 • Study dN, dE, dU non-linear weekly residuals (1998.0 – 2011.0) • bias errors not considered here ! 04
GPS dUp Time Series in TibXS Region (1/3) NRIL TIXI NRIL YAKT ARTU URUM CHAN BJFS KIT3 TASH BJFS Red points = raw GPS Turquoise = (GPS – Loads) 05
GPS dUp Time Series in TibXS Region (2/3) NOVM NOVJ KSTU NRIL NVSK IRKT URUM KRTV ULAB BJFS GUAO Red points = raw GPS Turquoise = (GPS – Loads) 06
GPS dUp Time Series in TibXS Region (3/3) SUMK URUM NRIL SELE CHUM URUM BJFS BISH POL2 Red points = raw GPS Turquoise = (GPS – Loads) 07
(GPS – Load) Comparison – WRMS Statistics • Load corrections are globally effective to reduce WRMS • most stations show reduced WRMS scatter after load corrections • especially for dU • but most residual variation still remains after load corrections • especially for dN & dE 08
(GPS – Load) Comparison – WRMS Statistics • Load corrections are globally effective to reduce WRMS • esp for dU – but most residual variation remains, esp for dN & dE • Loads are larger & therefore corrections more effective in TibXS • esp for dU – but smaller % improved for dE 09
(GPS – Load) Comparison – Annual Amp Statistics • Load corrections similarly effective globally to reduce annual amps • most stations show reduced annual signals after load corrections • dU amplitude reduced by half • but most annual variation remains for dN & dE 10
(GPS – Load) Comparison – Annual Amp Statistics • Load corrections similarly effective globally to reduce annual amps • dU amp reduced by half – but most annual variation remains for dN & dE • Loads are larger & therefore corrections more effective in TibXS • esp for dU – but less slightly effective for dE 11
A Generalized Model of Position WRMS • WRMS2 = WRMSo2 + (Ai * AnnAmpi)2 + WRMSi2 • WRMSo2 = globally averaged error floor, including: • basement electronic & thermal noise • a priori modeling errors (tides & basic geophysics) • other large-scale random analysis errors (e.g., orbits) • AnnAmpi = mean annual amplitude • Ai = 1 / sqrt(2) = 0.7071 or Ai2 = 0.5 → for stationary sinusoid • Ai2 > 0.5 → for non-stationary seasonal variations • includes loads + all other annual effects (e.g., technique errors) • WRMSi2 = local site-specific errors (non-annual part only), e.g.: • multipath + monument noise • antenna mis-calibration + GNSS hardware effects • thermal expansion of antenna installation & bedrock • tropomis-modeling + orbit errors • non-annual loads (& residual load model errors, if corrected) • inter-AC analysis & station usage differences + RF realization 12
Model of Position WRMS – Global Error Floor WRMSoerror floor 13
Model of Position WRMS – Annual Components add variable amounts of annual variation: AnnAmpi / sqrt(2) 14
Model of Position WRMS – Local Errors add variable amounts of local variations: WRMSi 15
IGS Results – dN With/Without Loads A2 : 0.5 0.6 • Load corrections have no impact on dN noise floor assessment • local site & non-load errors overwhelmingly dominate 16
IGS Results – dE With/Without Loads A2 : 0.5 0.6 • Load corrections have no impact on dE noise floor assessment • local site & non-load errors overwhelmingly dominate 17
IGS Results – dU With/Without Loads A2 : 0.5 0.6 • Load corrections move results much closer to dU noise floor • but local site & non-load errors still dominate 18
IGS Results – dU With/Without Loads A2 : 0.5 0.6 GLPS LAGO • “Best” 2 stations in dU (WRMS = 2.2 mm) are: • LAGO (S. coast, Portugal) & GLPS (island, Pacific Ocean) • loading effects moderated by nearby oceans due to inverted barometer 19
Evaluation of Error Sources: Error Floor • WRMS2 = WRMSo2 + (Ai * AnnAmpi)2 + WRMSi2 • WRMSo2 = globally averaged error floor, including: • basement electronic & thermal (receiver) noise • a priori modeling errors (tides & basic geophysics) • other large-scale random analysis errors (e.g., orbits) • Estimate thermal noise from differences between station pairs with shared antennas (19 globally) • Infer modeling + analysis error floors by quadratic differencing 20
Evaluation of Error Sources: Annual Signals • WRMS2 = WRMSo2 + (Ai * AnnAmpi)2 + WRMSi2 • AnnAmpi = mean annual amplitude • includes loads + all other annual effects (e.g., technique errors) • Ai2 ≈ 0.6 → from empirical IGS results • Most horizontal annual motions probably not caused by loads • technique errors are probably most important sources • dU load modeling seems fairly reliable (see next slide) • but non-load & technique errors are also significant for dU 21
Effectiveness of dU Annual Load Models raw GPS vs Load annual amps • dU load corrections appear rather effective at annual periods • e.g., no scale defect seen • but residual non-load annual signals also clearly remain • dN, dE load corrections have essentially no effect • non-load sources dominate annual signals • Need to identify sources for non-load annual signals • see following slides (GPS – Loads) vs Load annual amps • But no doubt that model load must have some errors too • probably largest errors from land water & ice/snow hydrology • e.g., inter-annual hydrology variations (see next slide) 22
Some Inter-Annual Signals Possibly Mismodeled • KIT3 (Kitab, Uzbekistan) & SELE (Almaty, Kazakhstan) both show significant inter-annual dU variations • load corrections partially effective • but inter-annual signals remain • Both stations also sit in basins in mountainous regions • unmodeled water/snow load signals appear plausible KIT3 SELE 23
Distribution of dU 4thDraconitic Signals Non-load Annual Signals: 1. Draconitic Errors • Draconiticyear = 351.2 d • or frequency = 1.04 cpy • 1st & 2nd harmonics overlay • seasonal signals • Strong spatial correlations in IGS position time series • fit (1.0 + 2.0 + 3.12 + 4.16) cpy • plot significant dU 4th harmonics (φ clockwise from N wrt 2000) • very striking in most regions • also seen in dN distribution • esp coherent in Europe • Amiri-Simkooei (2013) found mean 1st harmonic amps of: 1.4 (dN), 1.3 (dE), 2.8 (dU) mm • Implies orbit-related source • also seen in all other products 24
Non-load Annual Signals: 2. Temperature Cycle • Thermal dU expansion of antenna monument structures • ΔU (mm) ≈ 0.015 * (Hgt/m) * (ΔT/°C) • for Hgt = 3 m + annual ΔT = 30 °C => annual ΔU (mm) = 1.35 mm • so annual ΔT cycle probably significant for most stations outside tropics • Thermal dU expansion of surrounding bedrock • H. Yan et al. (GRL, 2009) • predict max annual amps • ~1.3 mm in NE Asia • Horizontal tilting of antenna structures • S. Bergstrand et al. (2013) measured diurnal tilting of ±1 mm for shallow drill-braced monument • tilting for other types usually larger • probably explains most dN/dE annual signals for stations outside tropics 25
Non-load Annual Signals: 3. IERS Models • Unmodeled ocean pole tide deformation • to account for centrifugal effect of polar motion variations on oceans • amps reach ~ 0.5, 0.5, 1.8 mm in dN, dE, dU, mostly near annual & Chandler (433 d) periods • IERS model in Conventions 2010, but not yet implemented • Aliases of errors in subdaily EOP tide model • K1, P1, T2 lines alias to annual periods • coupling through resonant 12-hr GPS orbits leads to draconitic errors • magnitude of position effects not yet quantified • Seasonal variations of low-degree geopotential terms • frame origin might shift by ~1 mm, mainly in Z component • WRMS orbit differences might reach few-mm level • Unmodeled S1/S2 atmosphere pressure loading • dU amps reach 1.5 mm in tropics with 12/24 hr periods • but should mostly average out for daily data processing 26
Non-load Annual Signals: 4. Antenna-Related Effects • Local multipath errors • especially due to near-field reflectors & environment changes • GPS ground tracks repeat with K1 (sidereal) period • can alias to GPS draconitic year (352 d) for daily processing • Snow, ice cover, rain on or near antennas • can add annual signals to data quality & sky visibility • most serious for stations at higher latitudes • Antenna calibration errors • similar alias effects possible, as with local multipath 28
Non-load Annual Signals: 5. Receiver Hardware • Receiver artifacts sometimes seen • e.g., receiver changed: AOA Rogue SNR-8000 → Trimble 4000SSI on 2005-08-02 • dU annual amp clearly increased after receiver swap • non-load annual amp also increased afterwards • no obvious impact for dN, dE • Such effects can occur due to improved/degraded sky coverage, SNR change, etc • While not unique, such receiver effects are not very common KRTV Red points = raw GPS Turquoise = (GPS – Loads) receiver swap 28
Non-load Annual Signals: 6. Other Effects • Troposphere delay mismodeling • due to errors in a priori dry zenith delay & dry/wet mapping functions • also errors in treatment of troposphere horizontal gradients • continuous progress being made • but ultimate solution of accurate, independent line-of-sight delays remains remote • Aliasing in long-term time series stacking • local position variations (including load effects) can alias into Helmert frame parameters to derive long-term positions & residuals • methods used to minimize effects but residual errors still not eliminated • Processing differences among Analysis Centers (ACs) • clear differences between ACs are sometimes seen for the same stations • effects include different draconitics but also more random variations • causes are unknown & probably diverse 29
Summary of Weekly GPS Position Errors • Noise floor WRMSo & local site errors WRMSi dominate over loads • especially for dN & dE components • unless load models missing about half of total signal • Local site WRMSi inferred by quadratic differencing • residual load model errors largest at inland stations • plus, high-frequency contributions from all other sources listed • Loads larger in TibXS region & corrections more effective for dU • Significant technique improvements still needed in many areas 30
Distribution of 4th GPS Draconitic in dU GPS orbit inclination = 55° GPS orbit inclination = 55° longitudes of GPS orbit node Right Ascensions
4th GPS Draconitic in Europe dN dE dU
Summary & Conclusions • Load corrections reduce WRMS & annual amps for most stations • but most residual variation remains, esp for dN & dE • implies load models are inaccurate &/or other sources of scatter/error • Station weekly scatter can be decomposed into 3 categories: • dNdEdU • global average floor WRMSo (mm) 0.65 0.7 2.2 • median annual amp WRMS (mm) 0.7 0.6 2.8 • (for A2 = 0.6; about half due to loads) • median local site WRMSi (mm) 1.0 1.1 2.9 • total WRMS (mm) 1.4 1.45 4.6 • Harmonics of GPS draconitic period are pervasive • strong spatial correlations imply a major orbit-related source • but significant draconitics in close pair differences imply smaller local contributions likely too • 1.04 cpy signal must contribute to observed annual variations but magnitude is unknown • Major non-load technique improvements still badly needed!
IGS Results – dU With/Without Loads LAGO (coast) GLPS (island) dN & dE scatters (~1 mm) are not the “best” . . . possibly related to weaknesses of IB assumption or load models dU scatters have same WRMS but different characters