Download
1 / 26
260 likes | 390 Views
This study evaluates the Saginaw Bay fish community's responses to environmental changes and management actions, focusing on nonnative species and walleye population trends. In the 2002 fall trawls, the spottail shiner was the most populous species, highlighting the fish community dynamics affected by invasive species like round goby. The report includes catch rates, length distribution data, and comparisons of decade mean catches for significant species. As we move into 2003, plans for further sampling and monitoring are outlined to continue assessing fish populations and health in Saginaw Bay.

E N D
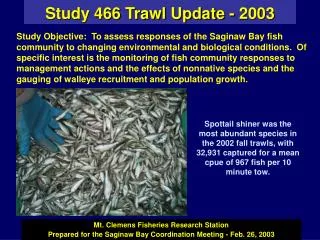
Study 466 Trawl Update - 2003 Study Objective: To assess responses of the Saginaw Bay fish community to changing environmental and biological conditions. Of specific interest is the monitoring of fish community responses to management actions and the effects of nonnative species and the gauging of walleye recruitment and population growth. Spottail shiner was the most abundant species in the 2002 fall trawls, with 32,931 captured for a mean cpue of 967 fish per 10 minute tow. Mt. Clemens Fisheries Research Station Prepared for the Saginaw Bay Coordination Meeting - Feb. 26, 2003
Locations of 2002 fall trawls on Saginaw Bay - DJ466 • Magenta 2002 • Yellow 2001 • Green 2000 • 2002 tows in yellow - total of 37 trawl tows at 11 Inner Bay grids • Total tow time of 249 minutes • Two outer bay stations (45 and 65 foot depths)
Mean secchi depth for SB fall trawl surveys(Inner Bay Only) No statistically significant trend in secchi depths.
Mean Secchi Depths by Grids • Magenta=2002 • Yellow=2001 • Green=2000 • Data presented in meters
Thirty-two Year Data Time Series of Fall Trawl CPUE for 4 soft-rayed forage species
AB B C A A AB AC BC A Comparison of Decade Mean CPUE for primary species captured in fall trawls on Saginaw Bay
B A AB A A A B A AB A B A AB Comparison of Decade Mean CPUE for primary species captured in fall trawls on Saginaw Bay
Catch rates for the common soft-rayed forage species in Saginaw Bay fall trawl surveys 6 out of the 7 highest totals for soft-rayed forage abundance have occurred since ZM’s colonized the Bay
Round goby catch rates declined slightly in 2002 – only 1 johnny darter caught in 35 trawl tows
Length frequency distribution for round goby from SB 2002 trawls
Round goby mean CPUE by grid for fall trawls • Blue=1999, Green=2000, Yellow=2001, Magenta=2002 • Increasing trend at all grids sampled • Highest cpue near Sag R.
Diet of Freshwater Drum from Saginaw Bay(expressed as frequency of occurrence) • Samples collected in trawls, Sept. 2002 • 88 fish examined • Total of 50 non-empty stomachs
Diet of Channel Catfish from Saginaw Bay(expressed as frequency of occurrence) • Samples collected in trawls, Sept. 2002 • 19 fish examined • Total of 10 non-empty stomachs
Diet of YAO Walleye from Saginaw Bay(expressed as frequency of occurrence) • Samples collected in trawls, Sept. 2002 • 33 fish examined • Total of 25 non-empty stomachs
Catch rates for the common spiny-rayed forage species in Saginaw Bay fall trawl surveys
SB Forage index and total biomass based on fall trawls Forage index species include: Alewife, Emerald shiner, Gizzard Shad, Smelt, Spottail shiner, Round goby, Trout-perch, White bass, White perch, Age 0 Yellow Perch
Age 0 walleye mean CPUE by Grid - 2002 • A total of 84 Age 0 walleye captured in fall 2002 trawls • Yellow indicates Zero grids
Age 0 Walleye CPUE for SB Fall Trawls and Walleye Fingerlings Stocked in SB 2002 trawl CPUE of 2.54 per 10 minute tow expands out to an estimated bay population of 838,888 Age 0 walleye
Mean CPUE for Age 0 and Yearling+ Yellow Perch in Fall Trawls
SB Yellow Perch Year Classes Ranked by YOY Mean CPUE • Ranked year classes based on mean Age 0 YP CPUE for fall trawls • Categorized as strong, moderate, or weak, based on natural breaks in the dataset • 1 strong, 3 moderate, and 6 weak cohorts in last 10 years • 2002 is a “weak” yearclass
YOY YP mean CPUE by grid • Green=2000 (8.6) • Yellow=2001 (121.6) • Magenta=2002 (30.7) • Highest 2002 YOY densities at Grid 115
Lower abundance, faster growth, higher proportion of harvestable fish
Commercial fishery catch rates and annual trawl YAO YP cpue for SB
Comm. fishery catch rates and total annual comm. YP catch for SB
Mt. Clemens Plans for SB 2003 Sampling • Trawl survey in September • Sample Inner Bay and Outer Bay sites • Collect carp pathology samples if available • Sample commercial fishery yellow perch for length, wt, age